Did my Net Promoter Score® really, really change?
Your dashboard says NPS is up 15 points week-on-week. Email's already drafted. Then you stop — was that real, or just sampling noise? Take credit for the rise this week and you'll be taking blame for the drop next week. Here's how to tell whether NPS has really changed, with a downloadable spreadsheet to check for yourself.
On this page
Whoohoo your Transactional NPS® system dashboard tells you the score is up by 15 points, week on week. Good news! Let’s get this out to the whole company!
But as you type out the note to the rest of the management team and prepare your article for the weekly company newsletter you wonder to yourself: “Did it really change or is it just statistics?”
Good Question
Yes, this is a good question and one to which you really need to know answer for before you announce it to the world. Take the credit for a 15 point increase this week and you might have to also take the “credit” for a 15 point drop next week.
Why is it important?
Knowing if Net Promoter or any other customer feedback statistic has really changed for the whole population is important for a number of reasons.
Taking action, or not
Most people have heard of the two errors you can make when interpreting statistical results.
False Positive This looks like something changed when really it did not. | False Negative This looks like nothing changed when really it did |
True Positive Something really did change | True Negative Nothing really changed |
Both False Positives and False Negatives are bad because they lead you to make the wrong decision.
If you think the NPS did not change in the last month and it actually did, you might wrongly think that the business change you had implemented had no impact and revert to the old process. This is a False Negative.
On the other hand a False Positive might lead you to think that the change you made actually had an impact, when it did not.
A corollary to this issue is getting emotionally whipsawed back and forwards as scores change. If your score goes up and down each week by 5 points you feel great one week and terrible the next. Not knowing what is driving this change can make the process even more frustrating.
Realising that the score can change by + or – 5 points but the population score is probably still the same, helps you keep your sanity.
So it is important to know what is really happening to prevent over-reaction, and under-reaction.
Variation analysis, or creative writing?
In many organisations there is a strong desire to explain the reason for variation from the target or change from last month’s results. Having a better understanding of what might be a False Positive can ease the burden on the creative writing skills of the analysts that put together the monthly reports.
If the change is within the Margin of Error, no variation need be explained and it can simply be noted: No Change.
Hey where’s my performance bonus?
The other big reason to get this right is when you have linked employee performance bonuses to Net Promoter results. This is a good idea, done properly and at the right time to setting NPS targets post, but done poorly can really impact on staff morale.
If your statistics falsely indicate that a change has happened (up or down) you can be underpaying or overpaying someone’s performance bonus. Either way they will become disengaged from the metric because it will be more difficult for them to understand how they can move the score.
Aside: One common problem with NPS linked bonus schemes is that they do not clearly set out the statistical variations in scores when they document the target. Organisations are experienced at setting performance targets for fixed items such as $30m in sales or “average handle time of less than 120 sec”.
These are known values because you can count each of the items in the system. You can (and do) count every sale; you know how long every call takes. The trouble is that you don’t know the “would recommend” score for every customer. So what you are actually doing is estimating the overall population NPS by collecting a subset of customers opinion.
Understanding that, when you set Net Promoter targets you should really do so using some type of confidence basis. For instance a better way of stating these goals would be “increase the score by 3 +/- 1 point based on 1,000 responses”. In this case any score between 2 and 4 would be considered to meet the benchmark for success.
Okay so how can you tell?
For most normal survey approaches there are some relatively simple and well known formulas that can tell you how big the sample error is for a particular response.
Net Promoter is not so straightforward.
Because the Net Promoter approach subtracts two sets of data from each other: Promoters – Detractors, you can’t simply use the same formulas on the overall score. In fact the statistics gets quite complex.
Satmetrix, have tried to assist in this process by producing the chart below. This shows the minimum differences between two NPS scores to come to the assumption that they really have changed.
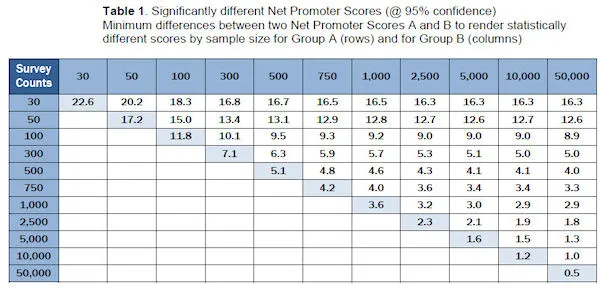
From “Creating a Sampling Strategy for Your Business” by Satmetrix
The trouble is that even this chart is not the full story. The error range will change for different ratios of Promoters and Detractors. Basically, if the ratio of Promoters to Detractors is higher or lower the score will be more accurate so the data in the chart is only a worst case scenario.
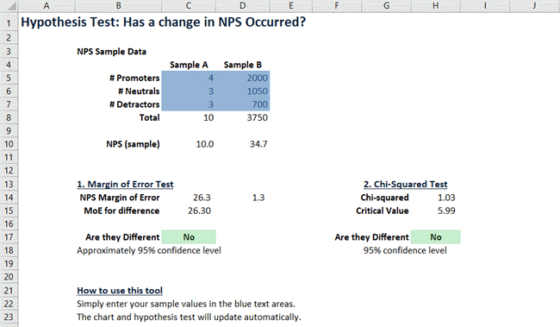
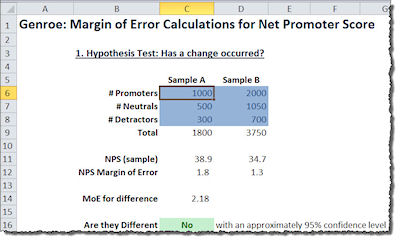
Download this Spread Sheet and check for yourself
Because the maths is quite complex we have put together a free Excel Spread Sheet into which you can simply enter your data and it will tell you if a change in the score has occurred. This will at least help you to prevent the False Positives.
If you are interested in the statistics behind this calculator you can check these blog posts:
- Using Margin of Error to determine if NPS has changed
- Using Chi-square to determine if NPS has changed
How do I get a more accurate estimate?
The simplest way to reduce the uncertainty in the NPS is to just collect more data.
Look at weekly data rather than daily data. Look at monthly results rather than weekly results. See what the product groups are doing rather than individual SKUs.
Generally more data, collected under similar conditions, will lead to smaller errors and more confidence.
Then when the score jumps 10 points over the quarter you really can take the credit.
Do you have any questions on how the analysis customer feedback responses? Please let me know below and I’ll endeavour to answer them for you.