NPS Segmentation Analysis
An aggregate NPS number tells you very little about which customers are loving you and which are quietly leaving. Segmentation does the heavy lifting — demographic for B2C, firmographic for B2B, behavioural for both. Here's how to slice NPS data effectively, with the rules that stop segmentation from devolving into noise.

On this page
To unlock deeper insights from your Net Promoter Score (NPS) data, segmenting your customer base is a crucial step. By breaking down your NPS responses into distinct groups based on shared characteristics, you can tailor your strategies for enhancing customer satisfaction and loyalty more effectively.
Here’s how to segment your NPS data effectively.
Key Takeaways
- Segmenting Net Promoter Score (NPS) data helps tailor strategies for enhancing customer experience by understanding different customer perceptions and needs.
- Demographic segmentation is crucial for B2C companies, enabling insights into customer preferences based on age, gender, and location.
- Firmographic segmentation, including industry type, company size, and revenue, is essential for B2B companies to address unique business customer needs effectively.
- Behavioural segmentation and analysing customer attributes like loyalty and spending levels provide deeper insights into customer satisfaction and loyalty drivers.
- Effective segmentation requires consistent data collection and analysis, integrating survey tools with CRM systems for accurate and actionable insights.
- Combining different segmentation criteria and using software tools for analysis and visualization can reveal targeted opportunities for improvement and guide strategic decisions.
- Regular monitoring and in-depth analysis of segmented NPS data are crucial for understanding customer loyalty dynamics and identifying areas for targeted enhancements.
Identify Relevant Customer Segments
Here are some examples of ways you can segment your NPS data.
You will of course need to review the details of your own business to determine if these are enough or if there are more needed.
One excellent way to do this is to look at how your business already segments its revenue and profit reporting. They variables have often been fine tuned over time. However, make sure you look beyond these variables so you don’t miss an important segmentation view.
It is also critical to segment along variables to which you have access. While it might be great to segment based on a psychographic profile – if you can’t attach that data to your NPS results you can’t segment on that basis.
1. Demographic Segmentation – Best for B2C Companies
Start with the basics: divide your customers by demographics such as age, gender, and location. This traditional segmentation helps you understand how different groups perceive your brand and products.
- Age: Different age groups may have varying levels of satisfaction or expectations from your products or services. For instance, younger customers might value innovation more, while older customers could prioritize reliability.
- Gender: Gender can influence how customers interact with your products and what they value in your brand.
- Location: Geographic location can significantly impact customer expectations and experiences due to cultural differences or regional trends.
2. Firmographic Segmentation – Best for B2B Companies
Firmographics is a crucial segmentation factor for B2B companies. Firmographics refers to descriptive attributes of organisations, including industry type, company size, location, and revenue. This segmentation helps tailor strategies to meet the unique needs of different business customers and enhance the overall customer experience.
Here is a list of some firmographic segmentation variables that are often important – but you will need to look closely at your industry to include others as needed.
- Industry Type: Different industries have varied needs and pain points. By segmenting your NPS data by industry, you can identify how your product or service meets these specific industry needs or where it falls short.
- Company Size: The size of a company often dictates its priorities, challenges, and decision-making processes. Small businesses might value flexibility and cost-effectiveness, whereas large enterprises may prioritize scalability and security.
- Location : The location of a business can significantly influence its expectations and preferences. Regulatory environments, economic conditions, and cultural factors vary by region and can impact how businesses perceive and interact with your product or service.
- Revenue : A company’s revenue can be a strong indicator of its spending capacity and strategic priorities.
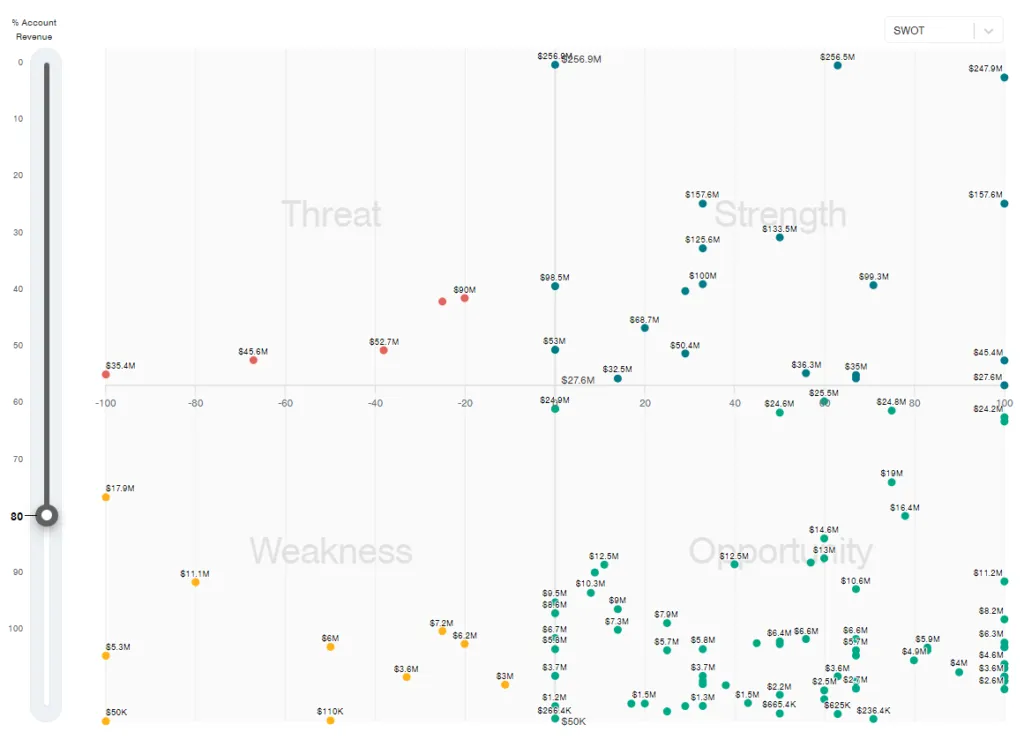
Example of NPS Revenue Segmentation
3. Behavioural Segmentation
Analysing customer behaviour offers insights into how different patterns of interaction with your brand affect loyalty and satisfaction.
- Purchase Frequency: Segment customers by how often they purchase from you. Frequent shoppers might have different expectations and experiences compared to occasional buyers.
- Product Usage: Look at which products or services customers use and how they use them. This can help identify which aspects of your offering are driving satisfaction among different user groups.
4. Customer Attributes
Going beyond basic demographics and behaviours, customer attributes like loyalty and spending levels offer a deeper understanding of your customer base.
- Loyalty: Segment customers by their loyalty status, such as new vs. returning customers. Loyal, returning customers might have higher NPS scores and can provide insights into what keeps them coming back.
- Spending Levels: Analysing NPS data based on how much customers spend can highlight whether your high-value customers are your brand’s promoters or if they have unmet needs.
How to Segment Effectively
Collect Data
Ensure your NPS survey collects or is linked to relevant customer data that allows for segmentation.
This might involve integrating your survey tool with your CRM system.
Where possible, it is always preferrable to link this data in the background from your business system rather than asking the respondent to provide the information.
Consider Combining Segments for Deeper Insights
Consider combining different segmentation criteria for more granular insights. For example, looking at the NPS score of high-spending young males in a specific location can reveal very targeted opportunities for improvement.
Ensure Consistent Segmentation
Ensure that the criteria for segmentation remain consistent across surveys to track changes and trends accurately.
Analysing Segmented NPS Data
Once you’ve segmented your NPS data, the next step is to analyse these segments to uncover actionable insights.
Here’s how you can calculate and compare NPS scores across different segments using methods like weighted averages, relative performance analysis, and gap analysis. We’ll also touch on software tools that can aid in analysis and visualization.
Calculating NPS for Each Segment
For each segment, calculate the NPS by identifying the percentage of promoters (customers who responded with a 9 or 10) and detractors (customers who responded with a score from 0 to 6). Subtract the percentage of detractors from the percentage of promoters to get the NPS for that segment. Passives (scores of 7 and 8) are excluded from the calculation.
The formula looks like this:

Weighted Averages
When comparing segments, consider using weighted averages if the size or revenue contribution of each segment varies significantly. This approach assigns more weight to segments that are more critical to your business, ensuring they have a proportional impact on the overall analysis.
Weights can be determined based on the size of the segment, its revenue contribution, or any other business-relevant metric.
Relative Performance Analysis
Relative performance analysis involves comparing the NPS of each segment to the overall NPS or to the NPS of a benchmark segment. This helps in identifying which segments are performing above or below average and may require additional attention or resources.
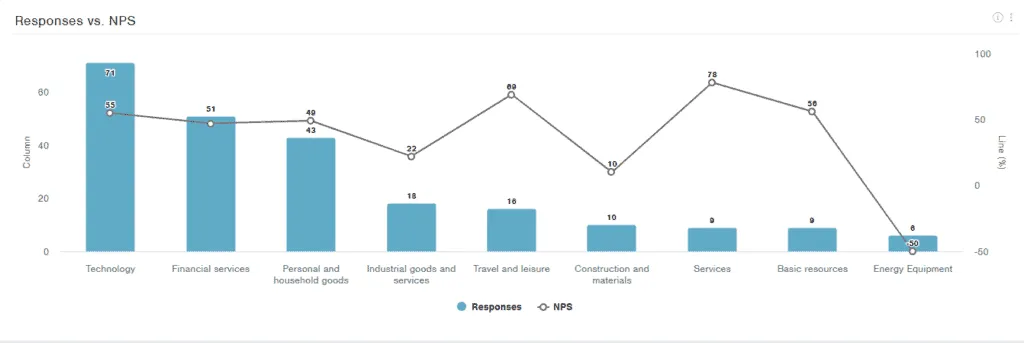
Example Relative Performance Analysis Chart – NPS Segmentation by Industry.
Gap Analysis
Gap analysis focuses on the differences in NPS scores within segments for similar categories, such as product features or service aspects. By identifying where the biggest gaps exist, you can prioritize areas for improvement.
Software Tools for NPS Segment Analysis and Visualization
In increasing order of technical skill required here are the three classes of software tools that can be used for NPS segment analysis
Survey and Analytics Platforms
Tools like CustomerGauge, Qualtrics and SurveyMonkey offer built-in features for segmenting and analysing NPS data. They can automatically calculate NPS for different segments and provide visualization options.
These tools are the most appropriate for day to day operations work as they are easy for non-technical staff to understand and apply.
Data Visualization Software
Tools like Tableau, Power BI, and Google Data Studio can connect to your data sources and help create dynamic dashboards. These dashboards can display NPS scores by segment, trends over time, and comparisons across segments.
However, these tools have steep learning curves and are generally used only by experienced data professionals.
Statistical Software
For more in-depth analysis, software like R or Python (with libraries like Pandas and Matplotlib) can be used for custom calculations, weighted averages, and gap analyses.
These tools require the highest level of technical expertise but do offer flexibility in analysis.
Advanced NPS Segmentation Techniques
For businesses aiming to extract deeper insights from their Net Promoter Score (NPS) data, advancing beyond basic segmentation techniques can reveal more nuanced understandings of customer loyalty and satisfaction. Here are three advanced segmentation techniques to consider:
A/B Testing Within Segments
A/B testing, also known as split testing, isn’t just for evaluating the effectiveness of web pages or marketing emails. It can be a powerful tool for understanding how changes in your product or service impact different customer segments’ NPS. By creating two versions (A and B) of your offering and exposing them to randomly selected members within a segment, you can measure which version drives a higher NPS. This method is particularly useful for testing hypotheses about what could improve satisfaction and loyalty in specific customer groups.
Longitudinal Studies to Track Changes Over Time
Longitudinal studies involve collecting NPS data from the same segments over extended periods. This approach allows you to track how changes in your business practices, market conditions, or product offerings affect customer loyalty and satisfaction over time. By observing trends within segments, you can identify which initiatives are improving your NPS and which may be detracting from it. Longitudinal analysis is key to understanding the long-term impact of business decisions on different customer groups.
Predictive Modelling to Forecast Future NPS Trends
Predictive modelling involves using statistical techniques to forecast future NPS scores based on historical data and segment behaviours. By analysing patterns in how segments have responded in the past, predictive models can estimate how changes in your business will impact your NPS in the future. Techniques such as regression analysis, machine learning, and artificial intelligence are often employed to create these models. Predictive modelling can be particularly beneficial for planning strategic initiatives and understanding their potential impact on customer satisfaction and loyalty across different segments.
Implementing Advanced Techniques
- Use the Right Tools: Advanced segmentation techniques often require sophisticated software and analytics platforms. Tools like SPSS, SAS, R, Python, and specialized machine learning platforms can support these analyses.
- Skill Development: Leveraging advanced techniques may require skills in data science, statistics, or analytics. Consider investing in training for your team or collaborating with data scientists.
- Continuous Improvement: Use insights from advanced segmentation techniques as part of a continuous improvement process. Regularly refine your approaches based on what you learn about your customer segments.
Interpreting and Acting on Segmented NPS Results
Once you have segmented your NPS data and analysed the scores, interpreting these results becomes crucial for making informed decisions that can improve customer satisfaction and loyalty. Here are strategies for understanding what segmented NPS scores mean for your business, along with questions to consider for each segment.
Understanding the Significance of Segmented NPS Scores
Segmented NPS scores offer a granular view of how different groups of customers perceive your brand, products, or services. High scores indicate strong loyalty and satisfaction within a segment, while low scores highlight areas needing improvement. To interpret these scores effectively:
- Compare Scores Across Segments: Look for patterns or anomalies. Are certain demographics more satisfied than others? Does usage behaviour correlate with higher loyalty?
- Trend Analysis: Evaluate how scores change over time for each segment. Are improvements or declines in certain areas affecting overall satisfaction?
- Contextual Factors: Consider external factors that might influence scores, such as market changes, recent product launches, or service updates.
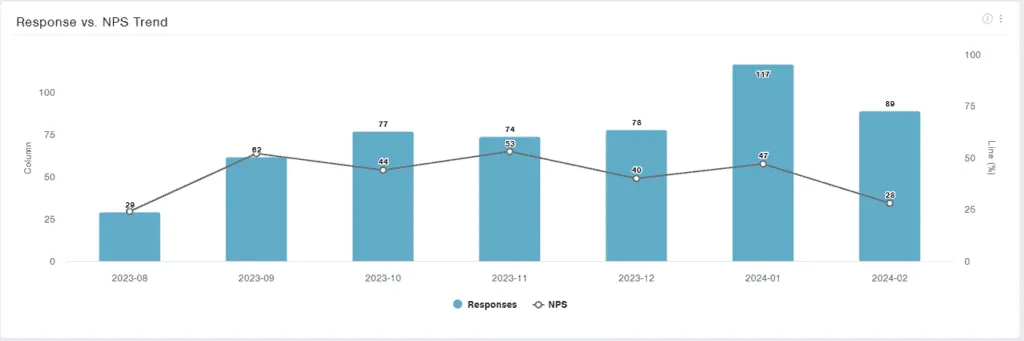
NPS Segment Trend Analysis Example
Questions to Consider for Each NPS Segment
For each identified segment, delve deeper to understand the nuances behind their scores. Here are some guiding questions:
- Promoters: What drives their high satisfaction and loyalty? Are there common features, services, or interactions they value most?
- Passives: What is missing for them to become promoters? Is there a particular aspect of the product or service they feel indifferent about?
- Detractors: What are the main drivers of their dissatisfaction? Are there recurring themes in their feedback related to product quality, customer service, or pricing?