

Your boss walks in with a chart of the last 12 months of transactional Net Promoter survey results and she’s not happy!
The score went down last month and she want’s to know why. Looks like you’ll have to hunt around to find a reason for the change; or will you?
Just because your survey score has gone down, or up, doesn’t mean that there has actually been a change in the overall business NPS. It might just be a fluke of the sample you have collected. The change might be within the Margin of Error.
In this post we’ll run through how to calculate all of the statistical values you need to understand if the NPS probably has gone down, or up. Or, skip ahead and download my free Excel NPS Statistics spreadsheet and just use that.

Margin of Error for NPS Data
Understanding Margin of Error
When collect data using a survey, say NPS, you are trying to determine the NPS of all your customers: the Population NPS.
The problem is that you are never able to collect a response from every single customer. In reality you make do with a sample; maybe 10%, 20% or whatever of your customers respond.
So, rather than calculating the Population NPS of all your customers you are only estimating it based on the customers who responded: the Sample NPS.
Now, by random chance you might get more responses from very happy or very unhappy customers. This results in the actual score being lower or higher than sample NPS of responses you have collected collected.
The problem is:
How do you know how close your sample NPS estimate is to the population NPS?
The answer is Margin of Error.
Using Margin of Error, you can be, say, 95% certain that the Population NPS for all your customers is between your sample NPS plus the Margin of Error and your sample NPS minus the Margin of Error.
If you’ve ever tried to understand the statistical terms around error and confidence intervals it’s easy to become confused. So just quickly I want summarise the meaning of each for clarity.
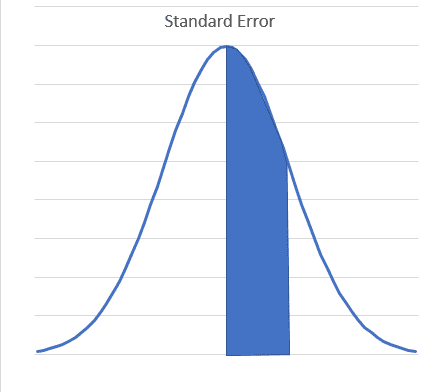
Standard Error – is a generic term that applies to many types of sample statistics (mean, standard deviation, correlation, etc). When we talk about Averages, the Standard Error is equal to the Standard Deviation of the sample.
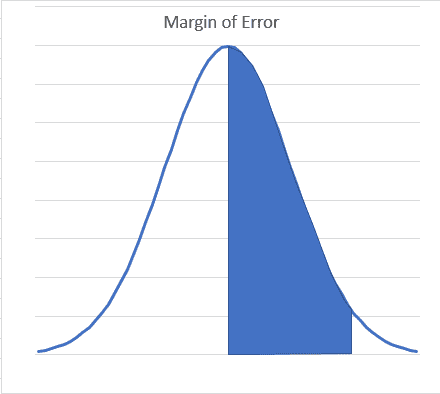
Margin of Error – the amount within which you are confident (e.g. 90%, 95%) that the population mean is above or below the sample mean.
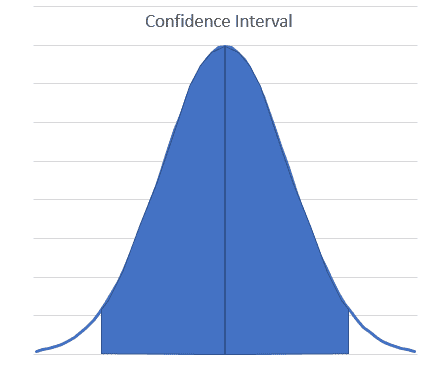
Confidence interval – this is the range within which you are confident (e.g. 90%, 95%) the population mean lies
Here is how those three terms are related.
Firstly Margin of Error and Standard Error:

Where Z is a value related to level of confidence, 90%,95% etc and is approximately 1.96 for a 95% level of confidence.
Then

So before you break out the hard hats and wait for the blame game to start you need to determine if the change in score is greater than the Margin of Error, i.e. outside the Confidence Interval.
Calculating Margin of Error for Net Promoter®
The problem with Net Promoter is that the statistics that you normally use for survey scores don’t work so well for NPS.
However, there is an approach that you can use to determine if the change is significant. This post “How can I calculate margin of error in a NPS result?” provides a very good and detailed response to the question.
Please note that the above referenced post equates Standard Error and Margin of Error. This is a little unusual and in the rest of this post we have preserved the approach in that post but used the terms Standard Error and Margin of Error in the more common way.
That post is quite technical and if you’re not statistically inclined, reading the post may not help very much. So here I will take you through the process step by step.
First you need to know more than just the score, you need the actual number of Promoters, Detractors and Neutrals in your sample:
- #P is the number of promoters
- #N is the number of Neutrals
- #D is the number of Detractors.
Now we calculate the total respondents:

Next calculate a version of NPS that is -1 and 1. We don’t multiply by 100 as we normally do. Here is the equation:

Now determine the Variance of the sample NPS using the discrete random variable approach:

Now calculate the Standard Error for your sample:

And, as above, our Margin of Error is approximately 2 times this value so:

Remember, this is the MoE for a -1 to +1 NPS so to get this back to the same range as your normal NPS you need to multiply it by 100.
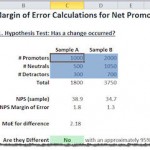
Applying Net Promoter Score Margin of Error
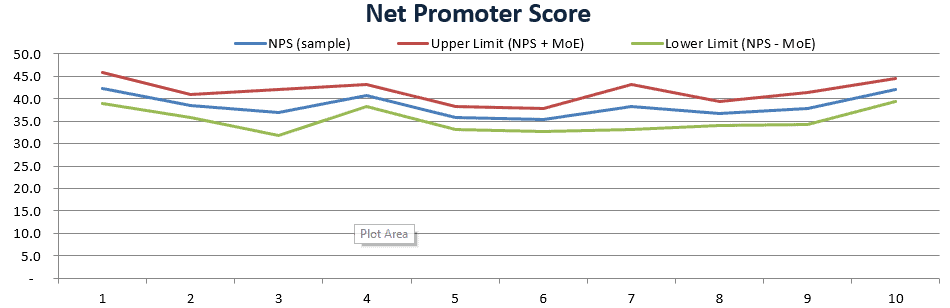
One way to use Margin of Error is add error bars to your charts. Simply add a couple of rows of values to your chart:
- NPS + MoE, and;
- NPS – MoE
Another approach is to perform the calculation for two different samples and end up with two Standard Errors you can compare.
To compare two such results you need to account for the possibility of error in each. When survey sizes are about the same, the standard error of their difference can be found by a Pythagorean theorem: take the square root of the sum of their squares. [source]
You can now use this information to determine if your score probably (95% confidence) changed between samples. Again the 2 in this formula is an approximation for the 95% confidence Z value of 1.96:

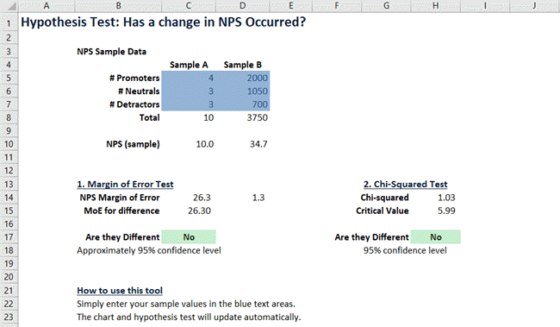
If that looks like it’s too much maths you can download our handy dandy NPS Margin of Error Calculator spread sheet.
All you need to do is enter the number of #P, #N and #Ds for each sample and it will tell you if the score has really changed and even provide a chart for you.
Problems with using NPS Margin of Error
So, we can use Margin of Error method to determine if the difference between two Net Promoter Scores® is probably real or probably just statistical noise but there are times when it doesn’t work so well.
For instance consider these two set of Net Promoter results:
Sample A
- Promoters=100
- Neutrals=0
- Detractors=100
NPS= 0
Sample B
- Promoters=0
- Neutrals=200
- Detractors=0
NPS= 0
Even though the two scores are the same, you can see that there is something qualitatively different between the results. However, looking at the score and even using the Margin of Error calculation implies that the scores are no different.
We can also use the Chi-Squared test on the NPS data – so let’s examine that approach.
Using the Chi-Squared Test on NPS Data
The Chi-squared test is a well known and simple statistical method used to determine if there is a significant relationship between two categorical variables by comparing observed data to what we would expect if there were no relationship.
The advantage of the Chi-Squared test is that it can be more discerning than margin of error.
Chi-squared can be used to determine if two sets of categorical data are different. Categorical data just means responses that are not numbers, e.g. Promoter or Detractor.
Aside: Interestingly the response from the “would recommend” question is numerical but by transforming the response into Promoters, Neutrals, Detractors the data becomes categorical.
The test basically works by looking at what we expect to happen and what actually happens, then looking at how similar they are.
This post is not trying to replicate a statistics course though so for more details on the actual calculation try starting at Wikipedia.
Using the Chi-Squared Test on Net Promoter Score Data
The chi-squared test is sensitive to shifts in the underlying values making up the NPS, not just the NPS score itself. So you can use this test to compare your Net Promoter samples.
Let’s go back and re-test our original data with this approach:
Chi-squared Value = 400.00
Critical Value = 5.99 (for 95% confidence, 2 degrees of freedom)
The Chi-squared value > Critical Value therefore there has been a change.
Once again that maths for this calculation, while not complex, can be a little difficult to follow. So we have updated our free download tool to be a Net Promoter Comparison Tester.
H.T Darren Nicholson for suggesting the use of the Chi-squared test on NPS data.
Which Test is Best for NPS Data: Margin of Error or Chi-squared?
In a sense there is no “best test” – only the test that you feel comfortable using.
In our NPS Statistics Excel download we provide calculations for both tests and we often get asked: “What if the tests disagree”, i.e. one test says no difference and one test says there is a difference.
Because, well, statistics, this can easily happen and your interpretation of the results depends on the risk you’re willing to take.
If you want to be very sure a change has occurred, or has not occurred, you should ensure both tests agree.
If on the other hand you’re less concerned you could take the view that if either test shows a change, or not a change, you go with that interpretation.
There is no right answer to this question, just the one that suits your situation.
Net Promoter Sample Size: How Many NPS responses Do You Need ?
Exactly how many responses you need to move beyond the NPS Margin of error depends very much on the range scores you receive and how many responses you have received.
So, lets’ do a couple of real world examples to get a feel for how different volumes of responses relate to the MoE in your NPS analysis.
Each of the examples generates an NPS of 10 but it takes a relatively large number of responses (at least 100) to start to reduce the statistical uncertainty in the score.
Example 1:
- 10 responses
- 4 Promoters
- 3 Neutrals
- 3 Detractors
- NPS = 10
NPS MoE: 52.6 points
Example 2
- 100 responses
- 40 Promoters
- 30 Neutrals
- 30 Detractor
- NPS = 10
NPS MoE: 16.8 points
Example 3
- 1000 responses
- 400 Promoters
- 300 Neutrals
- 300 Detractor
- NPS = 10
NPS MoE: 5.8 points
You can see that even for larger numbers of responses, say 100, the Margin of Error is quite large in NPS terms.