How to Calculate Net Promoter Score in Excel/Google Sheets [with Download]
You don't need a dedicated NPS platform to calculate NPS — Excel's COUNTIF function does the job in about three formulas. Here's a step-by-step build of an NPS calculator in Excel or Google Sheets, with the downloadable spreadsheet to adapt to your own data. Useful for piloting NPS before you commit to a paid tool.
In this post we will make ourselves a simple but effective Net Promoter Score calculator in Excel and Google Sheets using the COUNTIF function.
Calculating Net Promoter Score in Excel and Google Sheets
NPS is not a customer satisfaction score; it’s a crucial growth metric that helps businesses gauge customer loyalty and predict future business performance.
By tracking NPS over time, organisations can identify trends and correlate customer sentiment with business growth. This makes NPS a key indicator for decision-makers who want to focus on both customer experience and sustainable growth.
So let’s a quick review the formula for NPS.
NPS is calculated by using the responses to the following customer survey question:

The standard “would recommend” question used to derive Net Promoter Score
You will notice the response is an integer (whole number) between 0 and 10 – in the standard questions no fractional responses are allowed, e.g. 9.5.
We then define three groups of respondents:
- Promoters: are responses of 9 or 10
- Neutrals: are responses of 7 or 8; and
- Detractors are responses of 0 to 6.
Then the formula for NPS is:
It will make our spreadsheet easier to create if we apply a little algebra and re-write the equation as:
This score, although it looks like a percentage, should be referred to as a number.
You can see that NPS ranges all the way from:
- -100: where you have 100% Detractors to
- +100: where you have 100% Promoters
![]()
The full NPS range
Building an NPS Calculator in Excel or Google Sheets
Now we have the basic equation we can calculate the score in a couple of different ways in Excel and Google Sheets.
The easiest way to calculate it is to use the Excel COUNTIF function or the, basically identical, Google Sheets COUNTIF version:.
This function allows you to count the number of times the cell contents meets a certain criteria.
In this case we’ll count the responses in each of the three categories we are interested in: Detractors, Neutrals and Promoters.
For Promoters we’re looking for 9’s or 10’s and so the function looks like this: =COUNTIF(R:R,”>=9″)
For Detractors we’re looking for 0’s up to 6’s so the formula is : =COUNTIF(R:R,”<=6″)
And lastly for Neutrals we’re looking for just 7’s and 8’s: =COUNTIF(R:R,”=7″) +COUNTIF(R:R,”=8″)
In this case R:R is the whole column of responses that you have received for your survey.
The nice thing about using this function is that you can just copy and paste your scores into the column and Excel will count them for you.
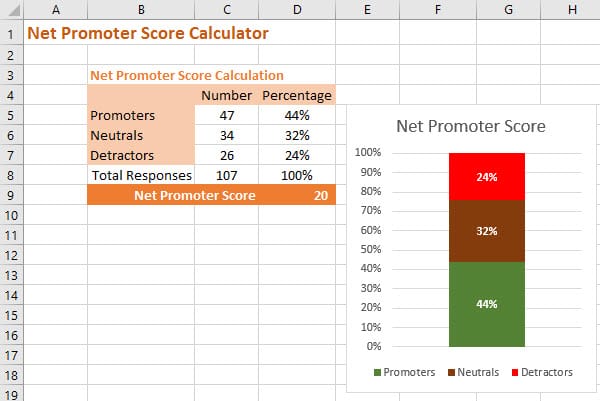
Now that you have the number of Promoters, Neutrals and Detractors you can add the equation for NPS to the spreadsheet.
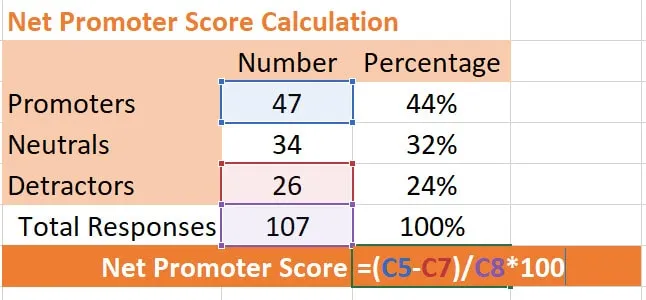
MS Excel and Google Sheets NPS formula
This is how the calculation looks in the spreadsheet itself. Remember to include the “(” and “)” or the calculation will be wrong.
Of course, you don’t have to do these two calculations separately. You can combine them into the one formula. Here, again, R:R is the column where you have your scores.
MS Excel and Google Sheets Compact NPS formula
Download Our Free NPS Calculator
Of course there’s not need to build it yourself, you can just grab our pre-built Net Promoter Score calculator in either Excel or Google sheets versions.
Both version allow you to simply copy and paste your data into a column and automatically calculate the Net Promoter Score and score ranges.