What Is a Good Net Promoter Score for a B2B Company in Australia?
Published B2B Net Promoter Score® benchmarks run from an Australian average of 0 in 2024 to vendor figures of 68 in 2026. Here are the figures with their sources, why they disagree, and how to tell whether your own score is good.

On this page
Australian business decision-makers rated their suppliers at an average Net Promoter Score® of 0 in Evolved Thinking’s 2024 study.
The 2025 and 2026 benchmarks from software vendors Survicate, Retently and CustomerGauge put their headline B2B figures between 38 and 68.
Both are real numbers. Neither tells you whether your score is good.
ACXPA’s Net Promoter Score glossary, as viewed in October 2026, gives a simple rule for Australia: above +30 is good and above +50 is excellent. A rule of thumb is a fair sense check.
By that rule, the average Australian B2B supplier in Evolved Thinking’s 2024 study falls well short, while the headline B2B figures in the 2025 and 2026 vendor benchmarks all clear it. In my view, that gap says more about how the numbers were collected than about how good the suppliers are.
The Published Australian and B2B NPS Figures
The published B2B Net Promoter Score figures below come from one Australian research firm and three software vendors. Each row names who answered, how many, and when.
| Source | Who Was Asked | Sample | Fieldwork | Published B2B Figure |
|---|---|---|---|---|
| Evolved Thinking, Australian B2B NPS Industry Benchmarks 2024 | Australian business decision-makers rating up to five of their suppliers | 996 people | July to October 2024 | Average 0. Education and Training +16, Engineering +12, Financial Services -1, Telecommunications -16, Consulting -18 |
| Evolved Thinking, Australian B2B NPS Industry Benchmarks, 2022 edition | Australian business decision-makers rating every supplier they had ever used | 3,349 people | October to December 2021 | Average 0, down from +8 in early 2020 and +2 in late 2020 |
| Evolved Thinking, Australian B2B NPS Industry Benchmarks, first wave | Buyers in Australian businesses rating their B2B suppliers | 990 businesses | January to March 2020 | +8 across every supplier ever used. +31 for current suppliers only |
| Survicate, NPS Benchmarks for 2025 | Respondents to NPS surveys run by Survicate’s customers, in several languages | 5.4 million responses from 599 companies | January to October 2025 | B2B median 38, against 49 for B2C. Manufacturing 66, Agency and Consulting 59 |
| Retently, 2026 NPS Benchmarks | Respondents to NPS surveys run by Retently’s clients, not split by company size or country | At least 10,000 surveys | Published April 2026 | B2B industry averages from 41 to 68. Consulting 68, Financial Services 68, B2B Software and SaaS 41 |
| CustomerGauge, NPS Benchmark Report: Decade Edition | B2B companies reporting their own programme scores | 340 B2B customer experience programmes | May to July 2026 | Healthcare highest at 65. Telecommunications 54 |
CustomerGauge is the B2B Net Promoter Score platform we implement as its exclusive partner for Australia and New Zealand. Its 2026 report says plainly that the scores are self-reported by the companies.
Why Buyer Surveys and Vendor Benchmarks Disagree
Buyer surveys and vendor benchmarks disagree because they ask different people in different ways.
Evolved Thinking asks Australian business decision-makers to rate their suppliers, and its waves from 2020 to 2021 counted every supplier they had ever used. Survicate and Retently pool the scores from NPS surveys run by their own customers. CustomerGauge collects scores that B2B companies report for their own programmes.
The same industry label shows how far apart those two approaches land. Consulting scored -18 in Evolved Thinking’s 2024 Australian study and 68 in Retently’s 2026 benchmark.
Both figures can be accurate. They measure different things.
In my experience, B2B customers give a supplier’s own survey a kinder score than they give an independent interviewer. Long-term clients are wary of upsetting a supplier they rely on, so the hard feedback tends to come out only when a third party asks.
How Survey Method Moves a B2B Net Promoter Score
Survey method moved one B2B company’s Net Promoter Score by 40 points in Van Bennekom and Klaidman’s study of 2011 data, across customers of the same company asked the same questions.
Three method choices show up clearly in the published B2B data: the channel, which suppliers the buyer rates, and who in the customer’s business answers.
Phone Versus Web Form
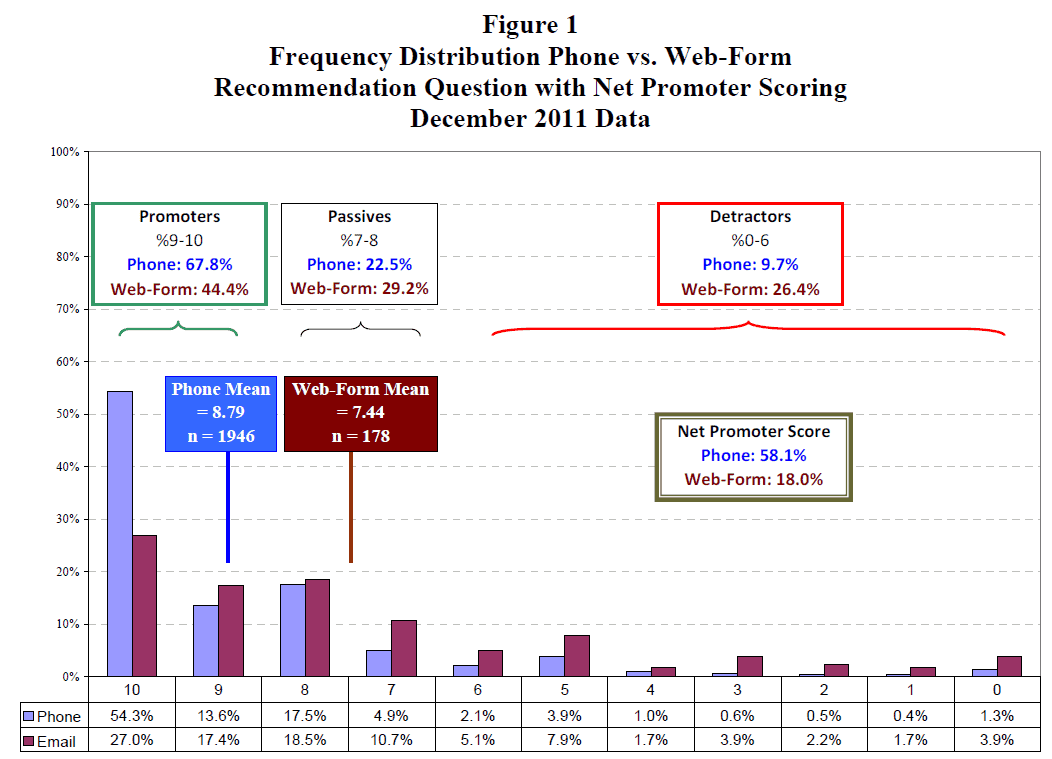
Frederick Van Bennekom and Samuel Klaidman analysed one month of transactional survey data from a large B2B company that services equipment for business customers in the United States and Canada. Their paper, Survey Mode Impact Upon Responses and Net Promoter Scores, used December 2011 data.
Customers were asked the same three questions by the same independent surveying firm, either by phone or by web form.
In Van Bennekom and Klaidman’s December 2011 data, telephone respondents produced a Net Promoter Score of 58.1 and web-form respondents 18.0, from 1,946 phone and 178 web-form responses.
The split was not random. Customers with an email address on file got the web form. The authors judged the difference too large for that alone to explain.
That matches what I see in B2B programmes. Phone interviews score well above email surveys for the same customers, which is why comparing NPS across survey modes is unsafe.
Current Versus Former Suppliers
Which suppliers a buyer is asked about moves the score as well.
In Evolved Thinking’s January to March 2020 wave, Australian buyers rated every supplier they had ever used at an NPS of +8. Rated on current suppliers only, the same 2020 Evolved Thinking survey gave +31.
A company surveying its own current customers sits on the current-supplier side of that split. An independent study that includes former suppliers does not.
Who in the Customer’s Business Answers
The role of the person answering changes the result too.
In Evolved Thinking’s 2020 wave, middle managers rated their suppliers at +11, senior leaders at +0 and subject matter experts at -4.
In B2B, the senior buyer at a large account matters more than a front-line user at a small one. A benchmark that counts every response equally cannot show that. Weight your own results by account value, not by response count.
How to Read a Published NPS Benchmark
Check four things before you compare your Net Promoter Score with any published figure:
- Who answered. A decision-maker panel, your own customers, or companies reporting their own scores.
- How they were asked. Phone, email, in-product or a mix, and whether an independent firm asked.
- Which suppliers they rated. Current suppliers only, or every supplier they have ever used.
- When, and how many. The fieldwork dates and the number of responses behind each industry figure.
If the benchmark answers those four the way your own survey does, the comparison means something. If it answers them differently, it is context, not a target.
What a Good B2B Net Promoter Score Looks Like
A good B2B Net Promoter Score is one higher than your own last result, measured the same way.
Beat Your Own Last Result
I tell clients that the most useful benchmark they have is their own score last quarter and last year. I explain why in this short video.
Keep the method fixed: the same channel, the same customers and the same timing. Then a change in the score is a change in your customers, not in your survey.
Do not turn a published benchmark into a staff target. Tying NPS to targets rewards people for managing the number rather than the customer.
Run Your Own Competitor Comparison
If the board needs to know where you stand against competitors, survey your customers and your competitors’ customers the same way, at the same time.
That is the only comparison where the method matches. The steps are in why external Net Promoter benchmarks waste your time, along with the case for benchmarking against yourself first.
Next Steps
If you need a competitor comparison you can trust, Genroe runs independent NPS benchmark studies. The same chat works if you want help reading your own trend.
Frequently Asked Questions
What is a good NPS?
- A good NPS is one higher than your own last result, measured the same way. Published benchmarks disagree widely: Evolved Thinking's 2024 survey of Australian business decision-makers averaged 0, while the headline B2B figures in the 2025 and 2026 benchmarks from Survicate, Retently and CustomerGauge run from 38 to 68. The gap comes from who was asked and how, so compare your score with your own trend rather than another organisation's number.
NPS benchmarks in the Net Promoter Score guide · Why external NPS benchmarks waste your time
What is a good NPS score for a B2B company in Australia?
- No external figure gives a reliable answer for an Australian B2B company. Evolved Thinking's 2024 study of 996 Australian business decision-makers put the average supplier at 0, with Consulting at -18 and Education and Training at +16. For a B2B company, a good score is one above your own previous result, collected the same way, because the method moves the number.
What is a good NPS rating?
- A customer who answers 9 or 10 on the 0 to 10 likelihood-to-recommend question is a promoter, 7 or 8 is a passive, and 0 to 6 is a detractor. The overall score is the percentage of promoters minus the percentage of detractors. A good overall result is one that improves on your own last result, because survey method moves published benchmarks.
What is the best NPS for an Australian business?
- The best NPS for an Australian business is the highest it can reach on its own consistent measure, not a league position. Evolved Thinking's 2024 study of Australian B2B suppliers averaged 0 across 996 decision-makers. ACXPA's rule of thumb, viewed in October 2026, calls above +30 good in Australia. Treat both as context and track your own trend.
What is the average B2B NPS in Australia?
- Evolved Thinking's 2024 study of 996 Australian business decision-makers, each rating up to five suppliers, put the average B2B supplier NPS at 0. Evolved Thinking's earlier waves gave +8 in early 2020, +2 in late 2020 and 0 in late 2021. Consulting scored -18 and Education and Training +16 in Evolved Thinking's 2024 study.