The Complete Guide to Acceptable Survey Response Rates
What's a good survey response rate — 1%, 15%, 50%? It's the wrong question. What actually matters is whether you've got enough responses to draw a conclusion, and that's a different number for every situation. Here's how to calculate the response rate you actually need, with the maths shown.

On this page
Focusing on increasing your survey response rate is important but I’m often asked:
What is the minimum acceptable survey response rate for a customer feedback survey: 1%, 15%, 50%?
This question also comes in the form:
What is the statistically valid response rate?
These are good questions but unfortunately the answer is not a single response rate but a range depending on what you are trying to determine.
In this post we’ll discover that what is important is not so much the response rate, but but the total number of responses. Then we’ll use that information to calculate the acceptable response rate for your survey.
Note: The approach here works well for standard customer feedback surveys but if you are using Net Promoter Score you need to look at this post: How to calculate Margin of Error and other stats for NPS®
How do you Calculate Survey Response Rate
Let’s start by confirming how to calculate the response rate for your survey. There are only two variables in the calculation;
Number of invites
This is the number of people you invite to take your survey.
It could be a “census” in which you ask everyone in your audience or it could be a “sample” where you only invite a proportion of people.
Number of responses
This the number of completed responses you receive for your survey. Note that you might also count partially completed responses if they provide valuable information for your business.
Response Rate
The calculation for response rate is simple: it is the number of responses divided by the number of people you invited to respond. The number is generally reported as a percentage, e.g. a 25% response rate.
In an equation that formula looks like this:
Survey Response Rate Formula
What is a Good Survey Response rate
A good survey response rate is one that is above average and, based on some industry data, that would be anything above 25% and subject to having enough total responses.
Industry response rate data
FluidSurveys published their average response rate for Email Surveys = 24.8%
SurveyGizmo also published the following chart
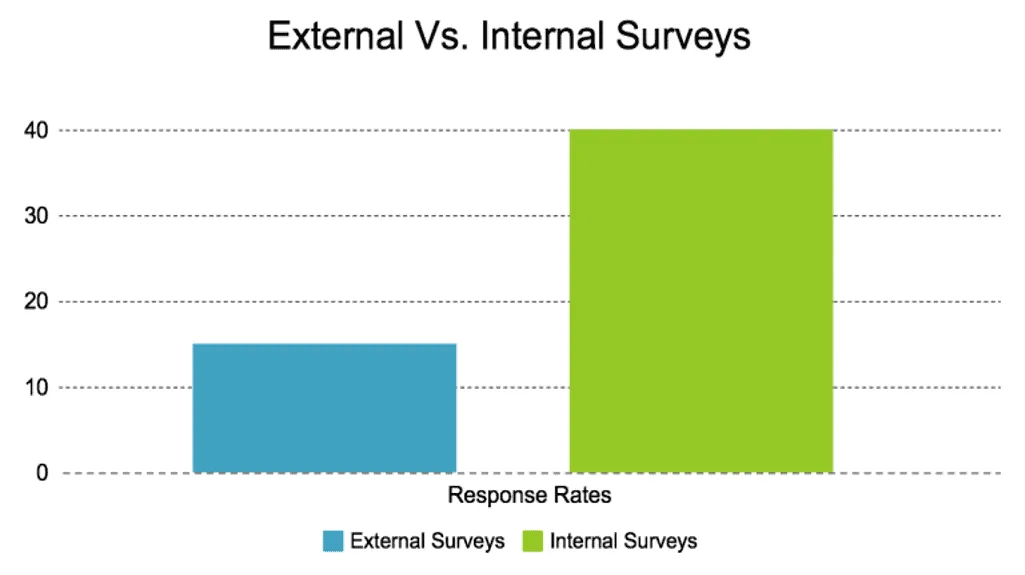
Real World External and Internal Survey Response rates
At Genroe our experience, with well crafted customer feedback surveys, is a response rate of between 10% and 30% depending on how engaged the audience is with the company.
What is a Good NPS Response Rate
A good good NPS response rate is one that is above around 20%, subject to having enough total responses.
See this post for more details on exactly how many responses you need: How to calculate Margin of Error and other stats for NPS®
You can see from this data published by CustomerGauge, using their extensive CustomerGauge NPS Benchmarks Survey, that most organisations (~51%) have response rates of 20% or higher.
If your response rate is below that figure you might like to review how you might improve your response rate.

NPS Response Rates
Statistically Valid Response Rates
In order to determine statistically valid response rates we first need to have a short discussion around Margin of Error and Confidence Intervals
If you’ve ever tried to understand the statistical terms around error and confidence intervals it’s easy to become confused. So just quickly I want summarise the meaning of each for clarity.
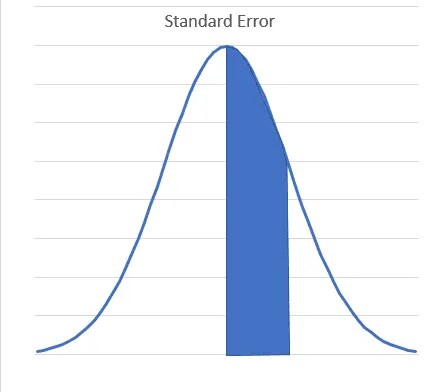
Standard Error – is a generic term that applies to many types of sample statistics (mean, standard deviation, correlation, etc). When we talk about Averages, the Standard Error is equal to the Standard Deviation of the sample.
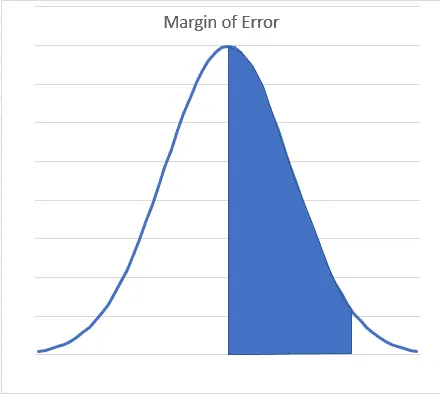
Margin of Error – the amount within which you are confident (e.g. 90%, 95%) that the population mean is above or below the sample mean.
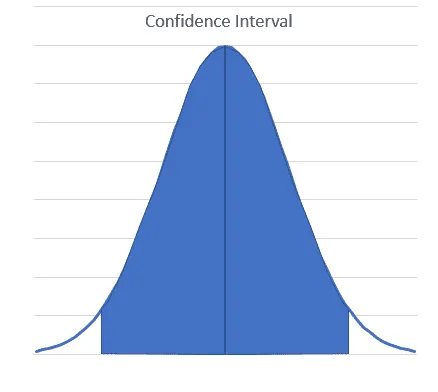
Confidence interval – this is the range within which you are confident (e.g. 90%, 95%) the population mean lies
Here is how they are related:
Margin of Error = Standard Error x Z (a value related to level of confidence, 90%,95% etc)
Confidence Interval = Mean +/- Margin of Error
What is an Acceptable Response Rate
Now we have a handle on the basic statistical terms lets look at what makes a response rate “acceptable”.
An acceptable survey response rate is one that allows you to use the information collected in the survey to make decisions in your business. That rate can vary dramatically.
While you could, for instance, make important business decisions with just 5 responses, and a very low response rate, using the “rule of 5”, most times you will need more responses so you can answer important questions:
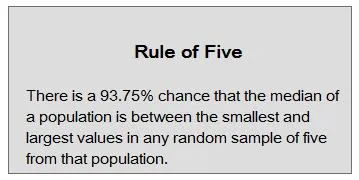
How to Measure Anything by Douglas Hubbard
You will most often want to, for instance:
- Decide if the average score has changed from one period to the next; or
- Decide if two attributes are significantly (in the statistical sense) different
In these cases the acceptable response rate will be the statistically valid survey response rate. There are a few things that affect that and here is the calculation for the number of responses required.
Source
Don’t worry too much about the detailed maths as we have a downloadable tool you can use to do the calculation. What is important, is understanding what drives the number of responses you need. Here:
- n is the minimum sample size
- Z is related to how confident you want to be in the answer, e.g. 90% or 95%
- σ is related to how much inherent variation there is in the population: does almost everyone give you a 5 or 6, or do you get a wide range of scores all the way from 1’s up to 7’s.
- E is the Margin of Error you want to be able to detect
So the acceptable survey response rate depends on those variables:
- If you want to be more confident you have detected a change, you will need a higher response rate
- To detect smaller changes, you will need a higher response rate
- If your population has more variation, you will need a higher response rate
As you can see, the number of responses is very important and that, along with the number of invitees, drives the minimum required response rate.
Calculating an Acceptable Survey Response Rate
Let’s move on to a practical use of this information. Above I talked about Standard Error. When determining an acceptable response rate this is a very important idea.
What we need to do now is to find the minimum number of responses that will give us the maximum error that we are happy to accept. That will then give us our acceptable response rate.
Said another way:
How many responses do we need, so we are confident the average is in the range of x +/- y.
We can do this with the equations above, just re-arranged a bit.
Here is a practical example where we want to be 95% certain that the average is in a range of +/- 0.5 on a 1-5 response scale. Here the minimum number of responses we need to be sure we are within that error range is 9, and so the acceptable response rate is 9%.
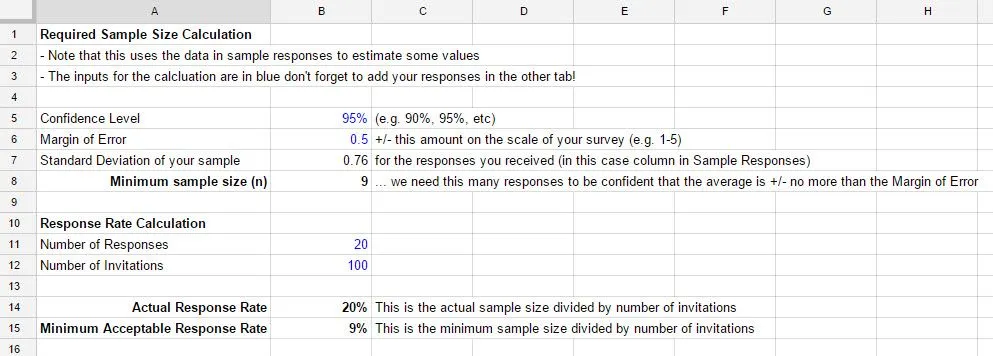
How to Calculate Acceptable Response Rate
Note: This calculator ignores non-response bias, i.e. it assumes responses are evenly spread among the entire population. See below for more information.
Low Survey Response Rates are not Always Bad
If you have a very large population then you may have a very small response rate but a large number of actual responses.
Take for example political polling. These polls try to forecast the winners of elections by surveying a very small proportion of voters.
You can see in the image below that the response rates are very small, e.g. just 0.0011% (1,690/ 146,311,000) but the data is still useful.
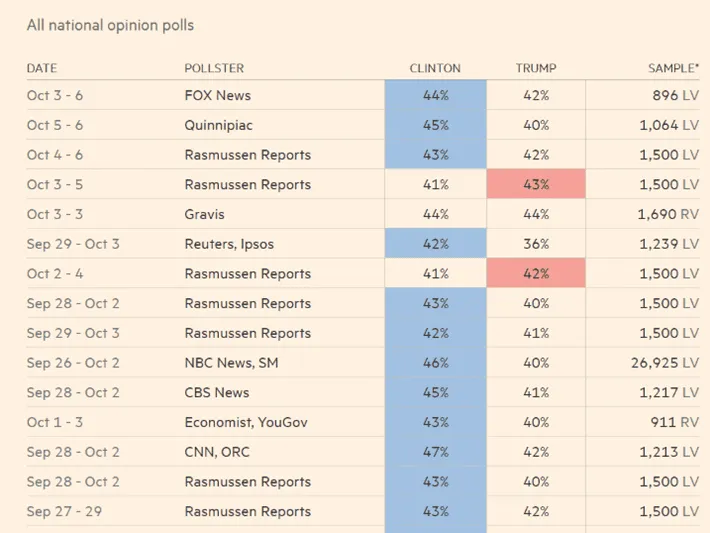
Source – Example of Low Response Rates That Are Also Valid Response Rates
Note: strictly speaking this example doesn’t show response rates as not all voters were invited to respond. In this case I am using opinion polls to make the point that it’s not just the percentage of responses that are important but also the total number of responses
Sample Bias and Acceptable Response Rates
Definition of Survey Sample Bias
Survey sample bias refers to systematic errors in the sampling process that result in a sample that does not accurately represent the population being studied.
Survey Sample bias may be introduced in several ways in customer feedback surveys:
Non-Response Bias Examples
Not all customers having the same ability to respond, e.g. asking survey questions in a language the customer doesn’t understand.
Not all customers respond at the same rate, e.g. Typically, for customer surveys, the very happy and very unhappy respond more than the middle group who are neutral.
Selection Bias Examples
All customer not having an equal opportunity to be invited to respond, e.g. contact centre staff intentionally entering incorrect contact details for unhappy customers and thus preventing transactional surveys from being sent.
The Impact of Survey Sample Bias On Acceptable Response Rates
Sampling bias has a major impact on acceptable response rates because it violates the basic assumptions upon which the underlying statistics are based.
That assumption is that the people that respond have the same profile as the overall population of customers.
What to Do about Potential Sample Bias
In practice addressing and resolving sample bias is important but doing so is problematic as often there is no consistent and practical way to address the issue.
The only approach is to be aware of the issue and try to mitigate it in the delivery of invites and collection of response as much as possible.
Survey Response Rate FAQs
What is a Good Survey Response rate
A good survey response rate is one that is above average and, based on some industry data, that would be anything above 25% and subject to having enough total responses. However, you need to make sure your survey response rate is above the minimum acceptable survey response rate.
What are the benefits of having a higher survey response rate?
Higher survey response rates will, generally, give you greater confidence that the feedback you’re receiving from a sub-section of the customer base is representative of how most/all customers feel. Higher response rates are always better but the acceptable customer survey response rate might be lower than you expect.
How can I make sure my survey responses are representative of my target audience?
To ensure your survey responses are representative of your target audience, it’s important to ensure your responses have a profile similar to the entire audience. For instance if your target audience is composed of 23% males but 58% of your responses are from males your sample may not be representative. Random sampling techniques can assist.
What is the acceptable response rate for surveys?
An acceptable survey response rate is one that allows you to use the information collected in the survey to make decisions in your business. That rate can vary dramatically. for some decisions it might be just a few responses, for others it might need 100%.


![How to Analyse Survey Data in Excel [+Video]](/_astro/how-to-analyze-surveys-in-exce-opt-e1607575803448.ZxA-rJo-.jpg)