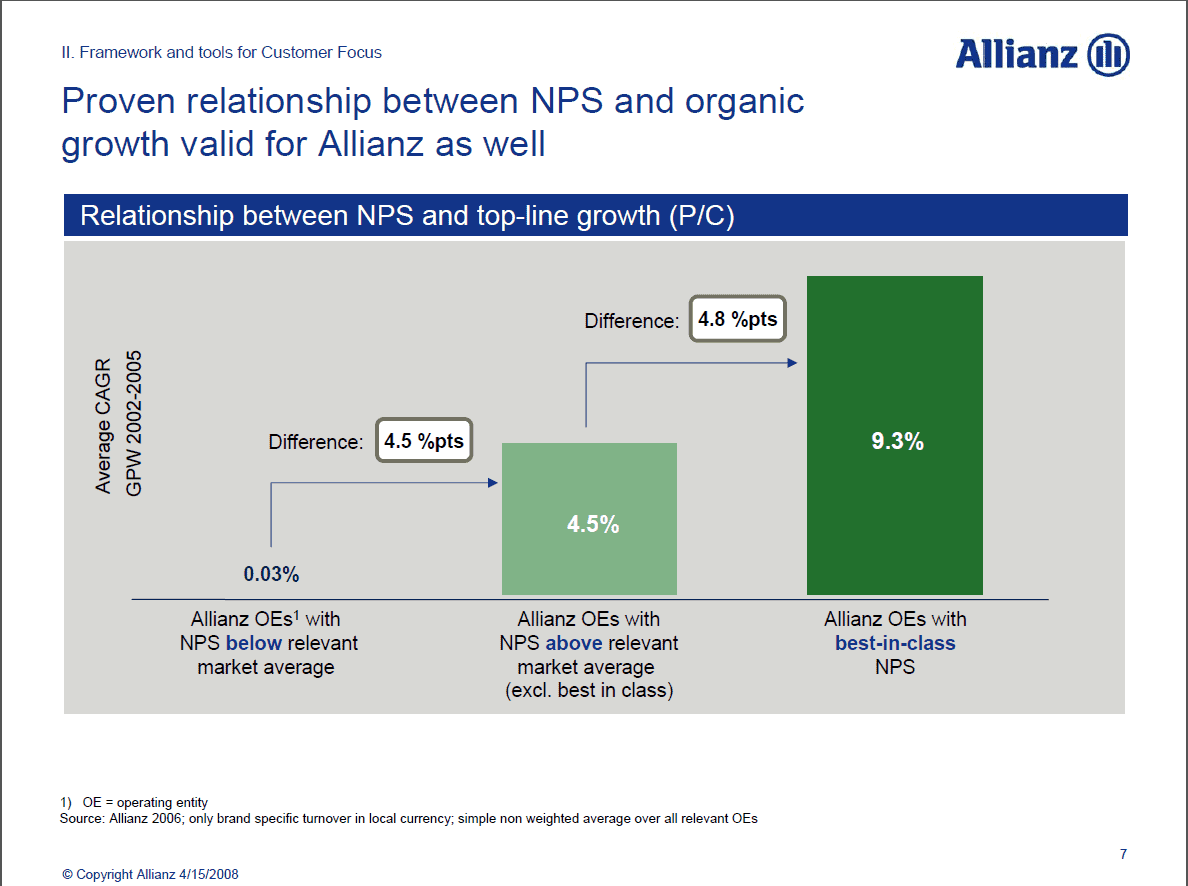
Which is Better: Net Promoter Score® or Customer Satisfaction
CSAT has been around since the 1980s, so it must be the safe choice, right? Not quite. Customer satisfaction does predict loyalty, but it tells you surprisingly little about company results. Here's what the largest study yet found, what NPS does differently, and which one to choose when you can only run one survey.

On this page
In the last 20 years, three customer experience metrics have competed to be the one most popular and recognised as predicting customer loyalty: Net Promoter Score (NPS), Customer Satisfaction and Customer Effort Score (CES).
While customer satisfaction is the oldest it is not necessarily the best. Both NPS and CES provide customer experience and loyalty insights that CSAT cannot.
In this post I’ll draw on my work with dozens of organisations to highlight the differences between NPS and CSAT to help you make a decision on which is best for your business.
What Are NPS and CSAT Used For?
There is just one reason to use NPS or CSAT: to predict customer loyalty.
Before suggesting which metric is better we need to understand why a company would use them.
This is an important ability for any company to have. If you are able to predict customer loyalty for an individual customer, it allows you to improve your business in the following ways:
- You can identify customers who might go to your competitors so you can intervene and stop them.
- You can understand what customers want in your service and product so you can improve them.
- You can identify gaps in your service delivery and product quality so you can correct them.
Introduction to Customer Satisfaction
Customer satisfaction was the first commonly used customer survey question designed to predict customer loyalty. From the early 1980s, this question was used by companies to try to identify loyal and not so loyal customers.
Organisations typically report customer satisfaction as an average of all the response scores – allocating 1 to a very dissatisfied response and a 5 to very satisfied response.
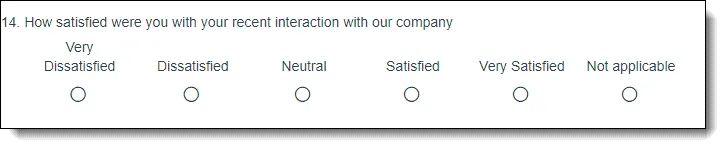
The Customer Satisfaction Question
The problem with customer satisfaction is that it is not consistently related to customer loyalty. This fact was widely publicised in a 1995 Harvard Business Review article titled Why Satisfied Customers Defect.
In the chart below you can see that depending on industry and product, the relationship between customer satisfaction and customer loyalty changes.
In practice, this varying relationship between satisfaction and loyalty makes it difficult to use customer satisfaction to predict customer loyalty in the real world.
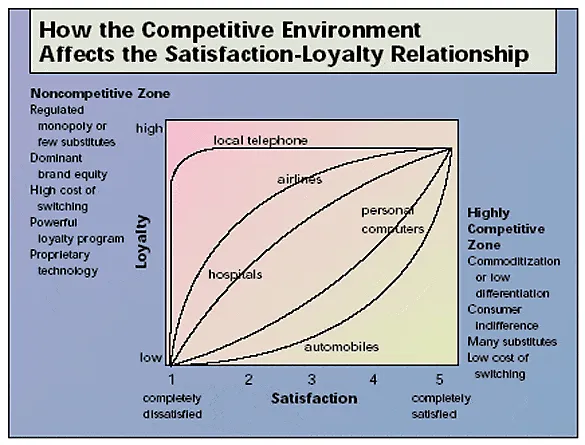
Source: The Varying Relationship Between Satisfaction and Loyalty
Introduction to Net Promoter Score
Net Promoter Score was the question that was most often the best predictor of customer loyalty behaviour in Fred Reichheld’s study.
NPS was first widely presented in another Harvard Business Review article titled: The One Number You Need to Grow in December 2003.
Unhappy with the existing customer loyalty prediction survey questions, particularly customer satisfaction, the author, Fred Reichheld, designed a study to find a better question. The study asked tens of thousands of customers lots of different questions and then cross-referenced their answers to loyalty using actual purchasing data.
With its demonstrated customer loyalty prediction effectiveness, companies began to use NPS in their businesses.
See this post for a more comprehensive introduction to Net Promoter Score.
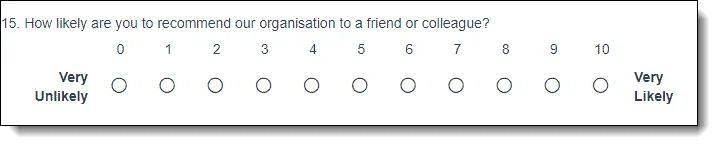
The Net Promoter Score question
Net Promoter Score Vs Customer Satisfaction
Customer satisfaction does predict loyalty, but the strength of that link varies by industry and product.
Both Net Promoter Score and Customer Satisfaction are customer survey questions which were designed as ways for organisations to predict the customer loyalty of individual customer respondents.
Net Promoter Score has been shown to be an effective predictor of customer loyalty, and in our own client data below it was the more sensitive of the two.
2026 Research: What 285 Million Ratings Say About Customer Satisfaction
Customer satisfaction correlates strongly with customer retention and word of mouth, but it has only a small link to revenue and profit.
In 2026 the Journal of the Academy of Marketing Science published the largest study yet of customer satisfaction and its outcomes. It analysed more than 285 million satisfaction ratings of 1,126 brands, owned by 458 listed companies, over 16.5 years (Customer satisfaction: A multi-level framework).
And it provides some interesting clarifications on the NPS vs CSAT discussion.
Satisfied Customers Do Stay and Recommend
The paper confirms that customer satisfaction correlates strongly with what customers do: r = 0.52 to 0.60 with retention, and r = 0.68 with positive word of mouth.
So satisfaction does predict loyalty to a certain extent, but the strength of that prediction varies by industry.
The Link to Company Results Is Weak
Importantly, when you move from customer behaviour to company performance, results are not great.
The meta-analyses the paper reviews find only a small link between satisfaction and revenue (r = 0.09 to 0.15) and profit (r = 0.10 to 0.13), and close to none with market share.
Satisfaction was statistically linked to sales and profit margin, but it explained very little of the difference in profit or market value between companies.
What Moved the Numbers Was Action
The most useful part of the paper for a B2B business is one case study. At ITI Manufacturing, the customer survey showed that two things lifted satisfaction most: a weekly update to every customer, and resolving every customer issue.
Lower prices and the sales process, the “normal” hot buttons, made no difference.
Within two quarters every customer was getting a weekly update and every issue was being resolved. Sales rose 20.6% against an industry control group, and gross margin rose 18.6%.
That is the point we make to every client, whichever metric they use. The score isn’t where the value is. Acting on what customers tell you is.
NPS Vs CSAT Case Study
In a case study with an Australian health fund, the “Would recommend” question was 2.7 times as sensitive as customer satisfaction as a predictor of attrition.
A few years ago we performed some Net Promoter Score work for a successful Australian health fund.
The survey process was a best practice transactional Net Promoter Score approach where they contacted the customer shortly after each touch point interaction and performed a short email survey.
What is unique about the survey data is that they asked both the “customer satisfaction” question (with comments) and the “would you recommend” (NPS) score (with comments).
The data set contained a large volume of free format comment data and we helped them to identify the comment themes for their data and then code the comments by the themes. They were provided actual customer loyalty data for us to integrate into the analysis.
This gave us a rather good opportunity to compare the effectiveness of customer satisfaction vs. Net Promoter Score.
NPS Vs CSAT As a Customer Loyalty Predictor
In summary we found that:
- A one point increase in “Would Recommend” score results in a decrease of risk of termination by 7.8%
- A one point increase in “Customer Satisfaction” score results in a decrease of risk of termination by 2.9%
This means that as a predictor of customer attrition the standard “Would recommend” question is 2.7 times as sensitive as customer satisfaction.
We also found that:
- The risk of attrition for Detractor respondents is 1.5 times that of Promoter respondents
NPS Comments Cover a Wider Range of Themes Than CSAT
The NPS question appears to be a more rounded review of the business.
We used the same set of themes to code the data for both Customer Satisfaction and Would Recommend questions. The chart below looks at how often each of the themes was coded for each question.
In the coding process we only identified the theme of the comment, not whether it was positive or negative. So the volumes that you see in the chart are representative of the customer’s perceptions of the relevance of that theme to either the customer satisfaction (CSAT) or “would recommend” (NPS) question. Each comment could be coded for more than one theme.
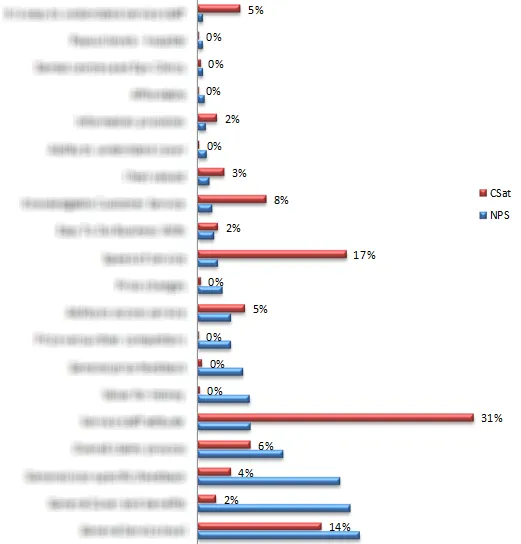
The first area to note is the substantially different theme coding rates for “would recommend” and CSAT.
Very few themes are coded consistently between the two questions. You will also notice that the NPS themes are coded more evenly. The maximum coding rate for NPS is about 16% but for CSAT it peaks at 31%.
Also, almost all of the themes are coded above the 1% rate for NPS while only 60% of the CSAT themes are coded at the same rate. This implies that customers consider a wider array of elements of the overall offering when responding to the “would recommend” question than when they respond to the CSAT question.
If we dive down into a couple of specific themes, this distinction becomes even more evident. For instance you can see that Speed of Service and Staff Attitude are top of mind for customers when considering CSAT but not considered as often when answering the NPS question.

Red is CSAT, Blue is NPS
On the other hand, pricing attributes are rarely considered when the customer provides feedback on CSAT but for NPS they are coded relatively often.

Red is CSAT, Blue is NPS
As I say, this was an imperfect, but relatively unique, opportunity to compare the areas that customers consider when providing a “customer satisfaction” or “would recommend” score.
However, because it was not designed from the outset to test the different themes customers considered when scoring the two questions we must be careful not to overestimate the significance of these results.
For instance, the order of the questions was always the same. This may lead to bias in the response. If you were to design this as an experiment from the ground up you would ensure that each question was shown first 50% of the time.
However, even allowing for its imperfect experimental design, it is a very interesting result.
Perhaps in these results we can see part of the reason that CSAT is less good as an indicator of future business growth. Our hypothesis is that because customers refer to fewer themes in their responses to the CSAT question than the NPS question, CSAT focuses more explicitly on the immediate service experience.
Note though that while the immediate service experience may be more important for the CSAT score, i.e. it may be skewed towards areas that are important for that experience, it may not cover all of those elements required to drive higher customer loyalty.
Potentially, customers consider a much wider range of areas in the total offering when answering the NPS question. Thus, the NPS question is a broader and more holistic response and better aligned to overall customer loyalty.
NPS Vs Customer Satisfaction FAQ
What is the difference between NPS and customer satisfaction?
NPS is based on a person’s willingness to recommend your company to another person and is a good indicator of customer loyalty. Customer Satisfaction is based on a person’s direct satisfaction with your company and is a less good indicator of customer loyalty.
Is NPS a measure of customer satisfaction?
No, not directly: NPS measures a person’s willingness to recommend your company, whereas customer satisfaction measures how satisfied they are with your company. However, if customers are very satisfied with your company they are likely to also recommend it. The two are closely linked: in the largest study of satisfaction to date, brands with more satisfied customers also scored higher on likelihood to recommend.
What is NPS customer satisfaction?
NPS customer satisfaction is not a customer experience term. NPS and Customer Satisfaction are distinct ideas in customer experience.