
Demonstrating the success of the Net Promoter Score methodology to skeptical senior management can sometimes be difficult. It is especially so if you are trying to prove it before your organisation has implemented any changes.
One way to prove the value of NPS® is to use external success stories and case studies to show what has been done by other organisations. Unfortunately, finding those case studies can be very difficult.
To overcome this issue, I have decided to create a list of case studies and references that are public domain. This blog post will be updated whenever I have new material.
This is an adjunct to my other source list post: Net Promoter Score Research: the “for” and “against” list
If you have results or a link to a published article, presentation or other source please let me know (Adam Ramshaw) and I’ll add it to this list so we can all benefit.
- Lifting NPS Leads to a Dramatic Drop in Cost of Customer Acquisition (B2C)
- Power Systems Parts and Service Company Wajax: Promoters Spend 2x Detractors (B2B)
- CRM Software provider SuperOffice, directly linked increased NPS with increased Promoter Spend (B2B)
- CX Leaders achieved more than double the revenue growth of CX Laggards between 2016 and 2021 (B2B and B2C)
- "An increase of one NPS point leads to sales growth of 1.458 pp. in the following quarter" (B2C)
- Gross Profit for Promoters Grows at 3 times the Rate of Detractors (B2B)
- NPS Correlates With Expansion Revenue (B2C)
- Philips Links NPS Change to Account Growth/Shrinkage (B2B)
- Global Technology Firm Links Higher NPS to Growth, Referrals And Retention (B2B)
- Leading Retailer Proves a 1% Lift in NPS = 0.5% Increase in Revenue (B2C)
- NPS Leaders Out Perform Vanguard Total Stock Index: 10.1x to 3.6x Value over 10 Years (B2B and B2C)
- Wajax: Promoter Revenue is 2x Detractor Revenue (B2B)
- SaaStr: NPS Doubled. Then, So Did Ticket Sales (B2B)
- Forrester Total Economic Impact™ Study
- Bain and Company (B2C)
- Macquarie Telecom Group (B2B)
- Temkin Group Research
- Business Telco Uses NPS To Increase Orders (B2B)
- IT Supplier Uses NPS to Find New Sales (B2B)
- IT Vendor Doubles Growth Rate (B2B)
- Forrester Finds Customer Experience Drives Revenue
- Global Communications Business Increases Sales by 13% (B2C)
- Global B2B Company Doubles Loyalty (B2B)
- Global Facilities Company Lifts Retention Rates 46% (B2B)
- Cablecom Find Lifetime Value Linked to NPS (B2C)
- A&E Television shows strong link between NPS and Ratings (B2C)
- Major Telco Links NPS to Churn
- Optus (Telco) Links NPS to Customer Experience to Reduction in Churn (B2C)
- Allianz Shows High NPS => High Revenue Growth (B2B)
- Retailers link NPS to Store Sales (B2C)
- Swiss Re Discovered that Promoters Pay More (B2B)
- eBay Linked NPS to Revenue (B2C)
- Maersk Link Shipping Increases with increases NPS (B2B)
- Health Insurance Provider nib links NPS to attrition rates (B2C)
- Multi-industry NPS -> Revenue growth linkages (B2C)
- American Express Links Shareholder value to NPS (B2C)
- Tech companies NPS linked to purchasing momentum (B2B)
- Organge France (Telco) Links Churn to NPS (B2C)
- Progressive Insurance Correlates Retention rate to NPS (B2C)
- Outsourcing Company links sales and revenue to NPS (B2B)
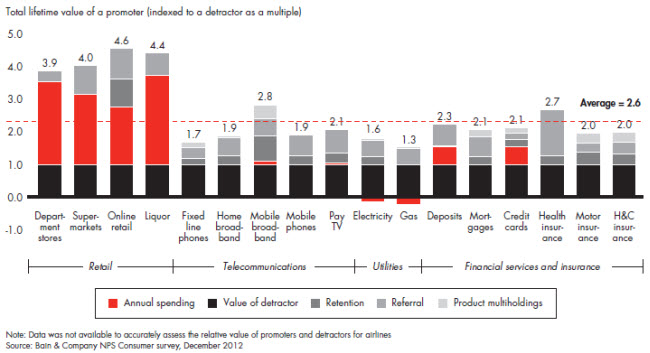
- Bain Calculates the Incremental Value of a Promoter — Multi-industry (B2C)
- Telco iiNet Directly Links Net Profit to NPS (B2C)
- Heineken Links Revenue to NPS (B2B)
- Stora Enso (Pulp and Paper manufacturer, B2B)
- British Gas NPS Turn Around (B2C)
- Symantec Reduces Costs (B2C)

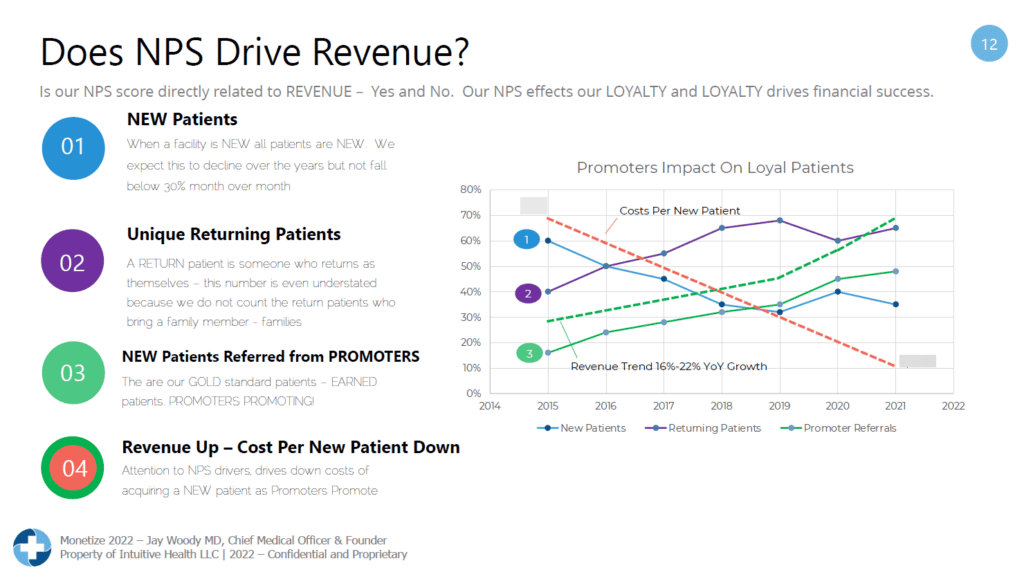
Lifting NPS Leads to a Dramatic Drop in Cost of Customer Acquisition (B2C)
Urgent Care group Intuitive Health LLC found that lifting NPS had a major impact on growth and cost of customer acquisition:
- Cost per customer acquired dropped by 80% over six years
- Year on Year revenue growth 16-22%
- Customer Retention lifted from 40% to 65%
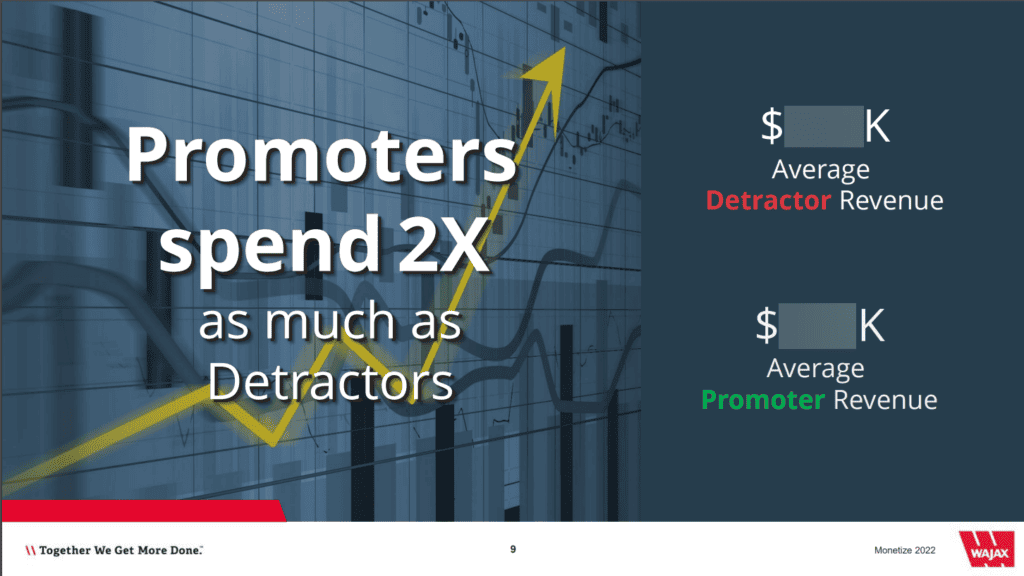
Power Systems Parts and Service Company Wajax: Promoters Spend 2x Detractors (B2B)
Wajax, the leading Canadian distributor in the sale, rental and after-sale parts and service support of equipment, power systems and industrial components shared that their Promoters spend 2x what Detractors spend.
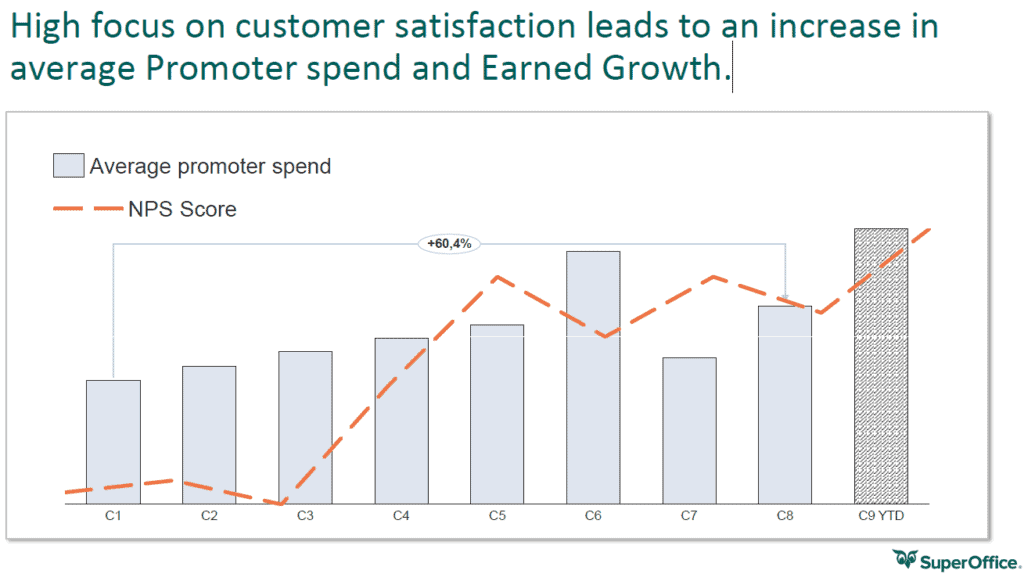
CRM Software provider SuperOffice, directly linked increased NPS with increased Promoter Spend (B2B)
SuperOffice, the #1 provider of CRM software in the Nordics, directly linked a high focus on customer satisfaction leads to an increase in average Promoter spend and Earned Growth.
CX Leaders achieved more than double the revenue growth of CX Laggards between 2016 and 2021 (B2B and B2C)
Bain analysis showed that CX Leaders, defined as companies with the top 50% NPS rating, outperformed CX Laggards between 2016 and 2021.

“An increase of one NPS point leads to sales growth of 1.458 pp. in the following quarter” (B2C)
In this (The use of Net Promoter Score (NPS) to predict sales growth: insights from an empirical investigation) study of the U.S. sportswear industry, focusing on seven of the biggest brands, which have a combined market share of two-thirds of the branded sportswear market.
It was established that:
An increase of one NPS point leads to sales growth of 1.458 pp. in the following quarter
Source
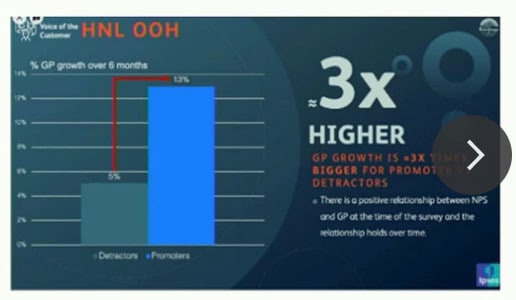
Gross Profit for Promoters Grows at 3 times the Rate of Detractors (B2B)
At the CustomerGauge 2022 Monetize Conference, Heineken revealed they had uncovered that Promoters in their business grew Gross Profit at three times the rate of Detractors.
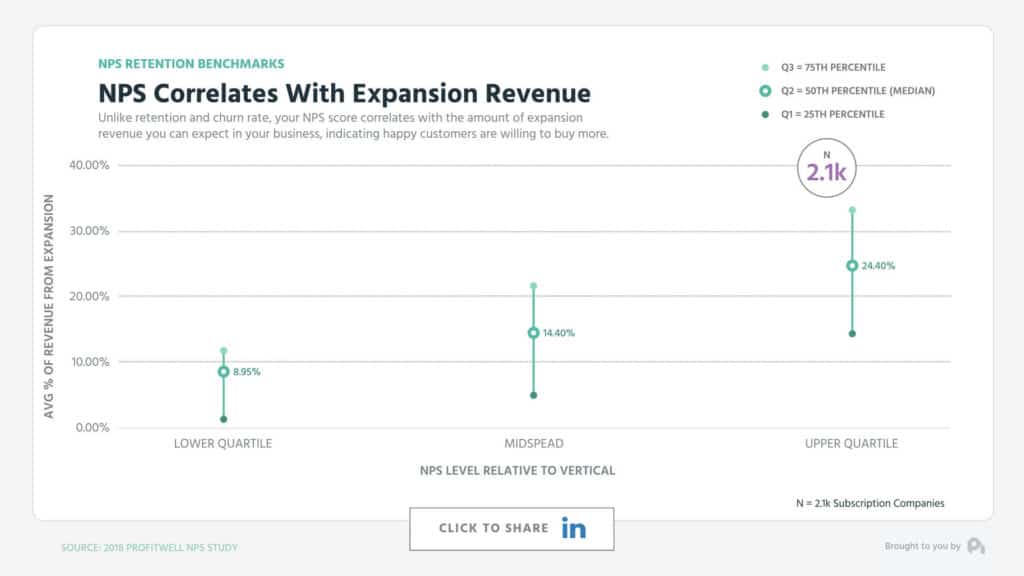
NPS Correlates With Expansion Revenue (B2C)
ProfitWell looked at data from two thousand companies and over ten thousand subscription consumers to identify links between NPS and customer retention and expansion.
They found:
Where as a company has higher NPS there is a stronger correlation to having more expansion revenue…
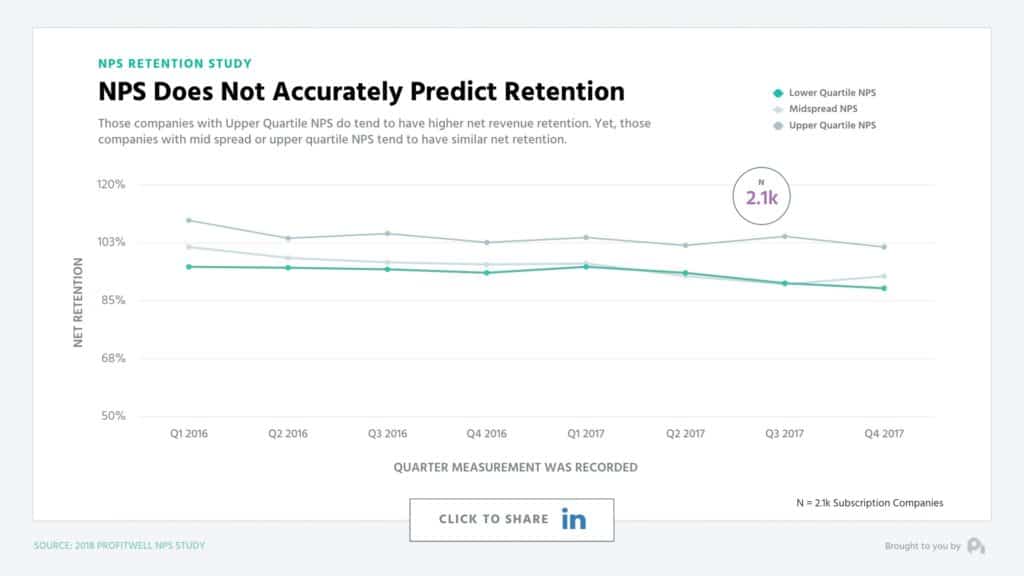
Interestingly they also interpreted some of the other data to suggest that NPS does not correlate with retention rate, see below.
They posit that high NPS companies have higher retention than low or middle NPS companies and so NPS does not predict retention.
An alternative interpretation is that to drive customer loyalty, companies need to have a higher NPS than their competitors.
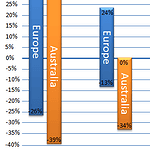
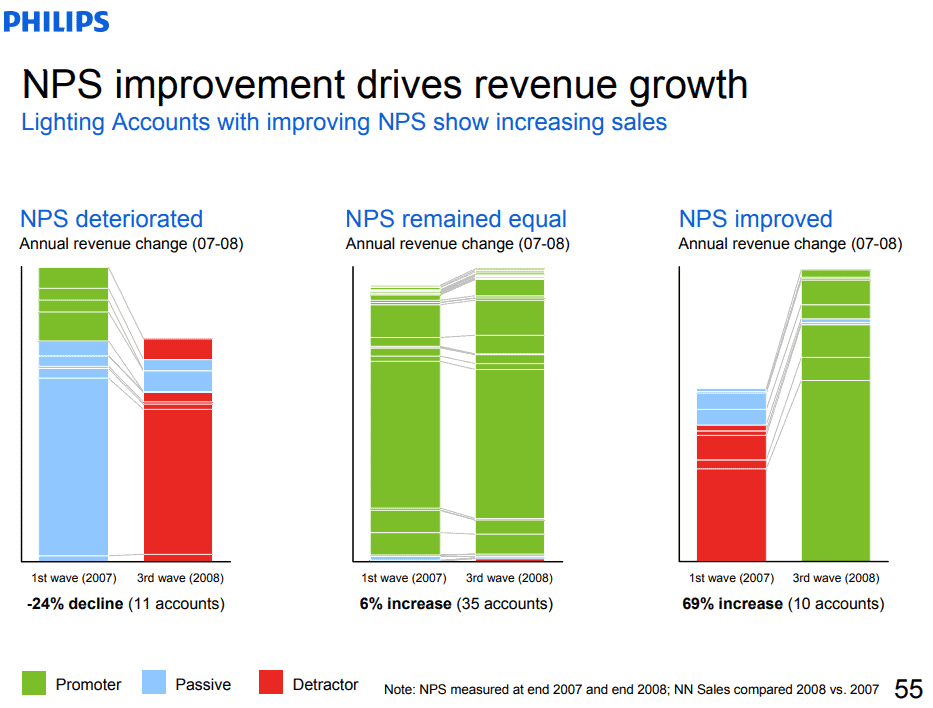
Philips Links NPS Change to Account Growth/Shrinkage (B2B)
Philips’ Lighting group linked changes in NPS at the account level to growth and shrinkage of revenue year on year. Where NPS increased there was an average of 70% revenue increase. Where it deteriorated, revenue declined 24%.
Global Technology Firm Links Higher NPS to Growth, Referrals And Retention (B2B)
Bain and Company released research by an un-named technology firm that clearly shows NPS is linked to: growth, referrals (the easiest sales), retention and cross-sell/up-sell (share of wallet).
Leading Retailer Proves a 1% Lift in NPS = 0.5% Increase in Revenue (B2C)
In this comprehensive study (The Effect of The Net Promoter Score on Sales: A Study of a Retail Firm Using Customer) DFS, the leading retailer in the UK living room furniture market demonstrate that increases in NPS are linked to substantial improvements in revenue.
In addition, we find that (ii) a sustained one percentage point (pp) increase in NPS across all UK stores corresponds to approximately a 0.5% increase in the company’s annual revenue. In financial terms, for DFS, this means that a one pp increase in NPS in each of its UK stores would result in an additional £3 million of company sales revenue per year. To put this in perspective, the additional annual sales revenue as a result of a one pp increase in the NPS amounts to more than the equivalent of an average infill store’s annual profit. In other words, more profit is generated by a one pp increase in NPS than by opening a new store, without having to invest the capital expenditure.
The Effect of The Net Promoter Score on Sales: A Study of a Retail Firm Using Customer, page 17
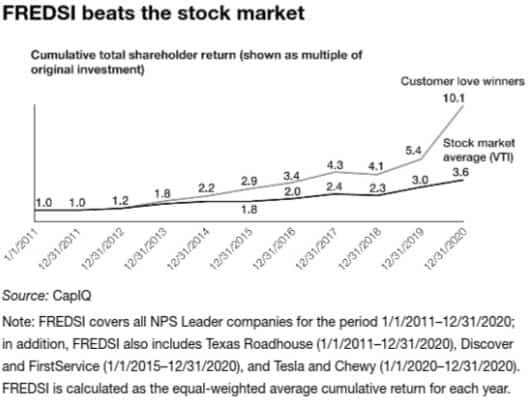
NPS Leaders Out Perform Vanguard Total Stock Index: 10.1x to 3.6x Value over 10 Years (B2B and B2C)
In his latest book, Winning on Purpose, Fred Reichheld outlines his FREDSI portfolio of stocks. The FREDSI is a stock portfolio based on companies that achieve the highest NPS in their respective industries.
Reichheld rebalances companies in the FREDSI each year based on their NPS levels.
Since 2011, the first year the FREDSI was created, the portfolio has averaged a 26% per annum return. This substantially exceeds the Morningstar “best mutual funds” return of 19% per annum.
It also equates to a 10.1 times return over ten years, almost triple the Vanguard Total Stock Index return of 3.6 times in the same period.
Wajax: Promoter Revenue is 2x Detractor Revenue (B2B)
Wajax is a Canadian diversified industrial products and services provider founded in 1858.
In this case study of it’s NPS program they revealed that the revenue they generate from Promoters is twice the revenue they generate from Detractors.
SaaStr: NPS Doubled. Then, So Did Ticket Sales (B2B)
SaaStr is the world’s largest community of SaaS executives, founders, and entrepreneurs.
This year, they lifted the NPS for their annual conference by 30 points from 2018 to 2019 and saw a dramatic increase in their ticket pre-sales for next year’s event.
But did +30 NPS points really matter? Early evidence suggests a resounding — Yes. Our ticket sales are up 204% Year-over-Year.
Source
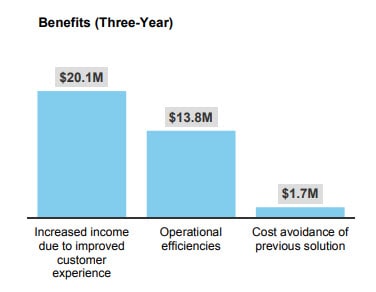
Forrester Total Economic Impact™ Study
A recent Forrester study estimated the financial impact of implemented an NPS management system across a range of organisations. The estimated impact is below.
Note that the dollar value of the impact is not the key learning here. Different sized organisations will have different absolute improvements.
What is key here is to note value is generated by both increased customer loyalty AND improved operational efficiencies. This matches with our experience implementing NPS – where we see operational efficiency driving as much business value as increase income from customer loyalty.
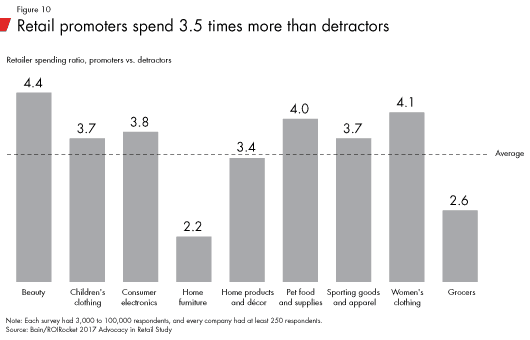
Bain and Company (B2C)
Bain and Company is a global management consulting firm that advises executives of large businesses on critical decisions. They’ve calculated through their retail client’s results with NPS programs that promoters spend 3.5 times more than detractors.
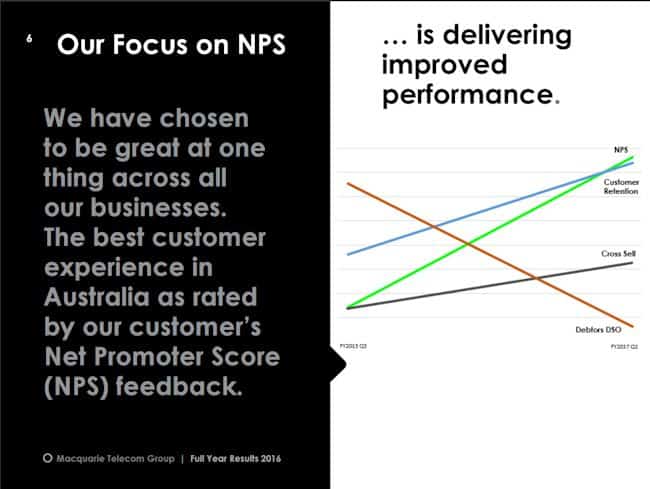
Macquarie Telecom Group (B2B)
Macquarie Telecom Group are an Australia’s data centre, cloud, cyber security and telecom company for mid to large business and government customers. They have identifed that their customer retention and cross sell have increased while debtors have decreased as Net Promoter Score has improved.
Temkin Group Research
Research from Temkin indicates:
NPS was highly correlated to the likelihood of a customer to purchase more from a company (R = 0.81).
When compared with detractors: …
– promoters are more than five times as likely to repurchase from companies
– more than seven times as likely to forgive companies if they make a mistake
– almost nine times as likely to try new offerings from companies.
Business Telco Uses NPS To Increase Orders (B2B)
Business Telco provider used NPS process to increase orders by 150%.
IT Supplier Uses NPS to Find New Sales (B2B)
IT Product Supplier used NPS process and identified new opportunities in 39% of follow-up meetings.
IT Vendor Doubles Growth Rate (B2B)
IT Vendor used NPS process and doubled growth rate in accounts that participated
Forrester Finds Customer Experience Drives Revenue
According to Forrester, Customer Experience affects the bottom line: Annual revenue change from a modest shift in customer experience for a $10 billion company!
- Buying more products: $64million
- Reduction in churn: $116 million
- Word of mouth $103million
Source: Forrester
Global Communications Business Increases Sales by 13% (B2C)
Global Comms business identified the need to improve order processing that increased loyalty and improved margins. Increased sales by 13% in a single digit growth industry.
Global B2B Company Doubles Loyalty (B2B)
A Global B2B has a quarterly review of results and action plans with Executive team, team leaders, sales leaders. Achieved 100%+ increase in loyalty, double digit growth in mature market.
Global Facilities Company Lifts Retention Rates 46% (B2B)
According to Forrester, a Global Facilities company improved their retention rates by 46%, using the Net Promoter process.
Source: Forrester
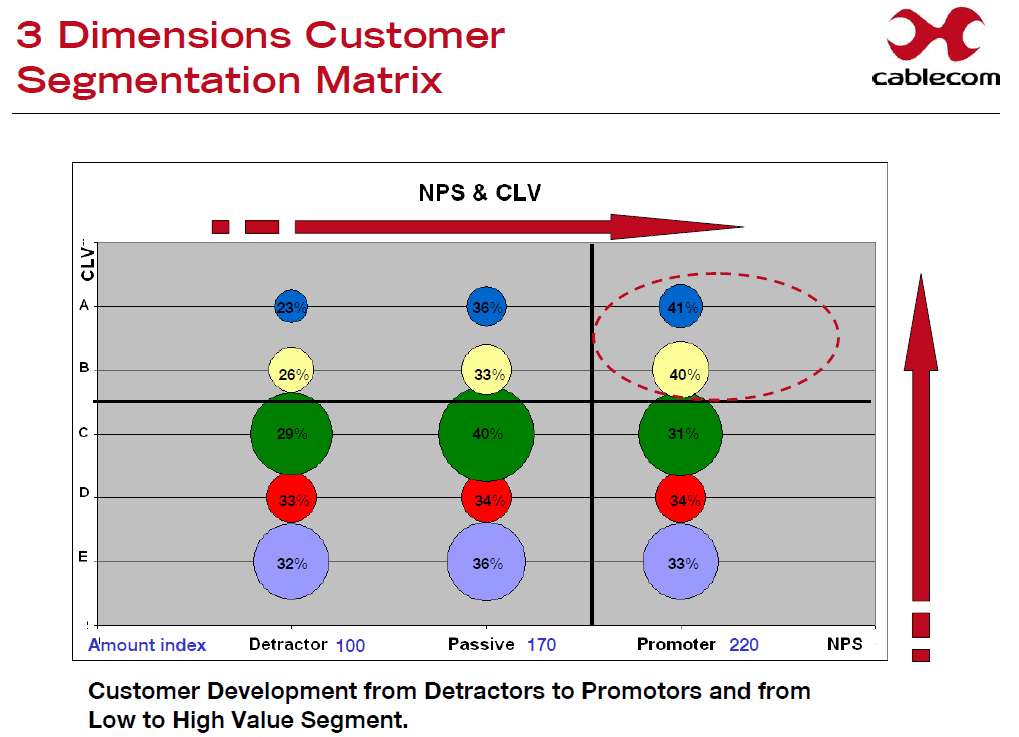
Cablecom Find Lifetime Value Linked to NPS (B2C)
The image below shows a chart of Customer Lifetime Value Vs. NPS. If you review it you will see that the Promoters (9 or 10) make up 40% and Detractors (0-6) make up 24% of the highest value group.
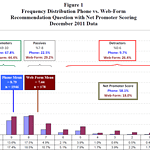
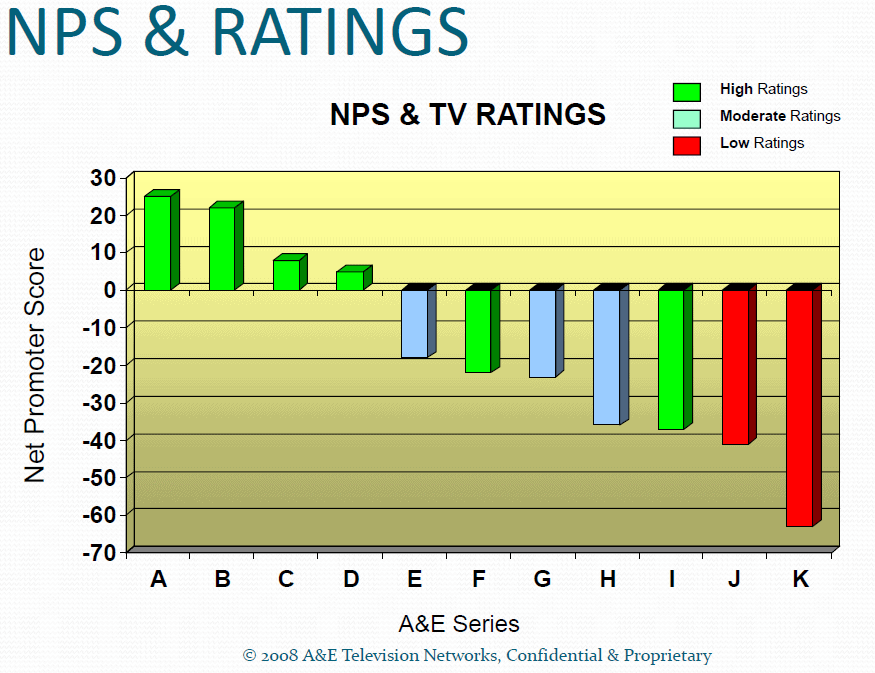
A&E Television shows strong link between NPS and Ratings (B2C)
The chart below shows that Net Promoter Score and Ratings are mostly correlated for A&E Television shows. Low NPS drives Low Ratings, High NPS drives High ratings.
Major Telco Links NPS to Churn
A major Telecom company was able to deliver a 25 point increase in NPS which lead to a 3% reduction in early life churn and a 5% increase in first call resolution.
Optus (Telco) Links NPS to Customer Experience to Reduction in Churn (B2C)
“Optus’ country chief officer Kevin Russell said that the carrier’s customer-focused initiatives were paying off, with a 50 per cent decline in the number of new complaints to industry ombudsman and a six points jump in its Net Promoter Score over the December quarter.
“This has put Optus’ benchmarks for customer experience into positive territory for the first time in a number of years,” Optus said in a statement.
“These customer experience improvements are reflected in a reduction in mobile postpaid retail churn to 1.4 per cent.”
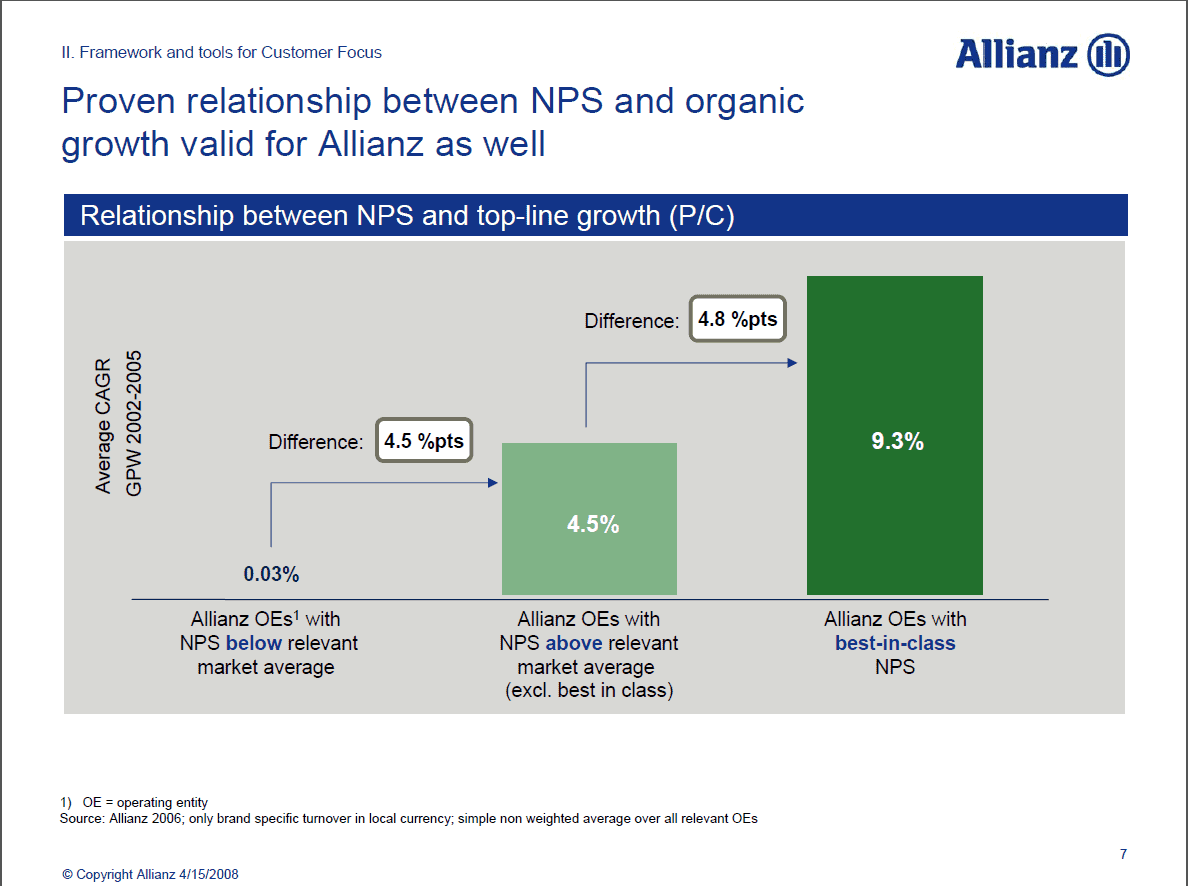
Allianz Shows High NPS => High Revenue Growth (B2B)
The chart below shows that Allianz operating units with a high NPS have a higher overall compound annual growth rate (CAGR) than those with lower overall NPS scores.
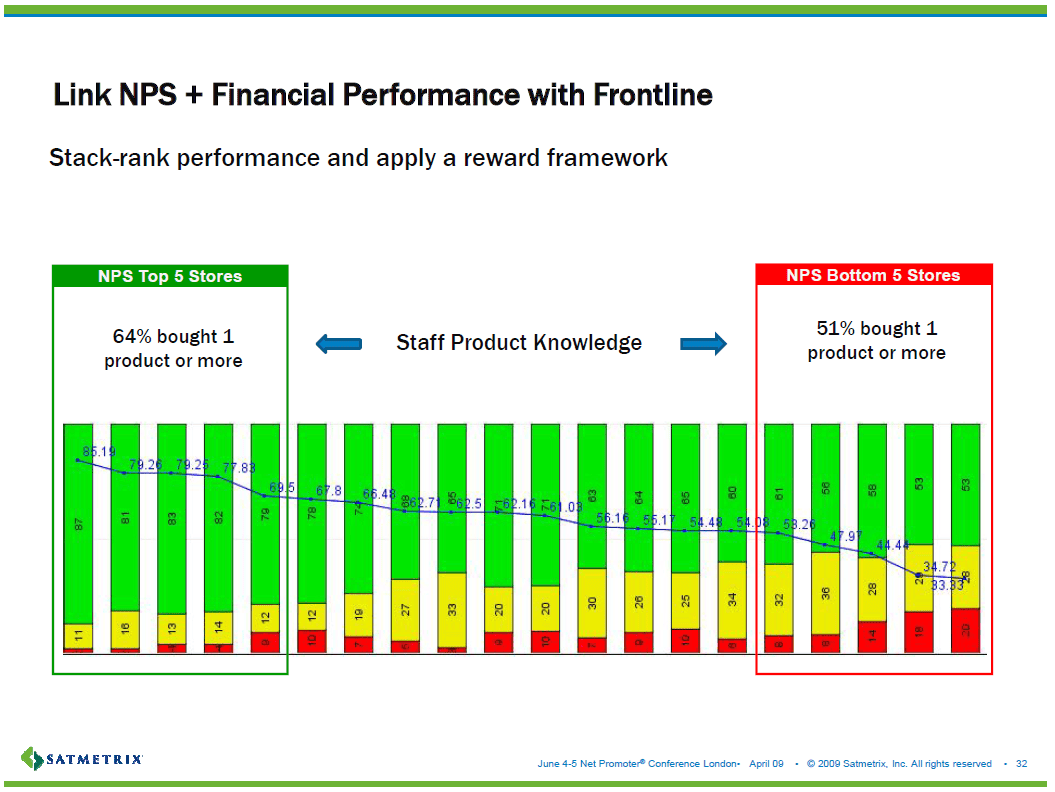
Retailers link NPS to Store Sales (B2C)
The chart below shows that in stores with a high NPS customers bought one or more product 20% more of the time than stores with a low Net Promoter Score
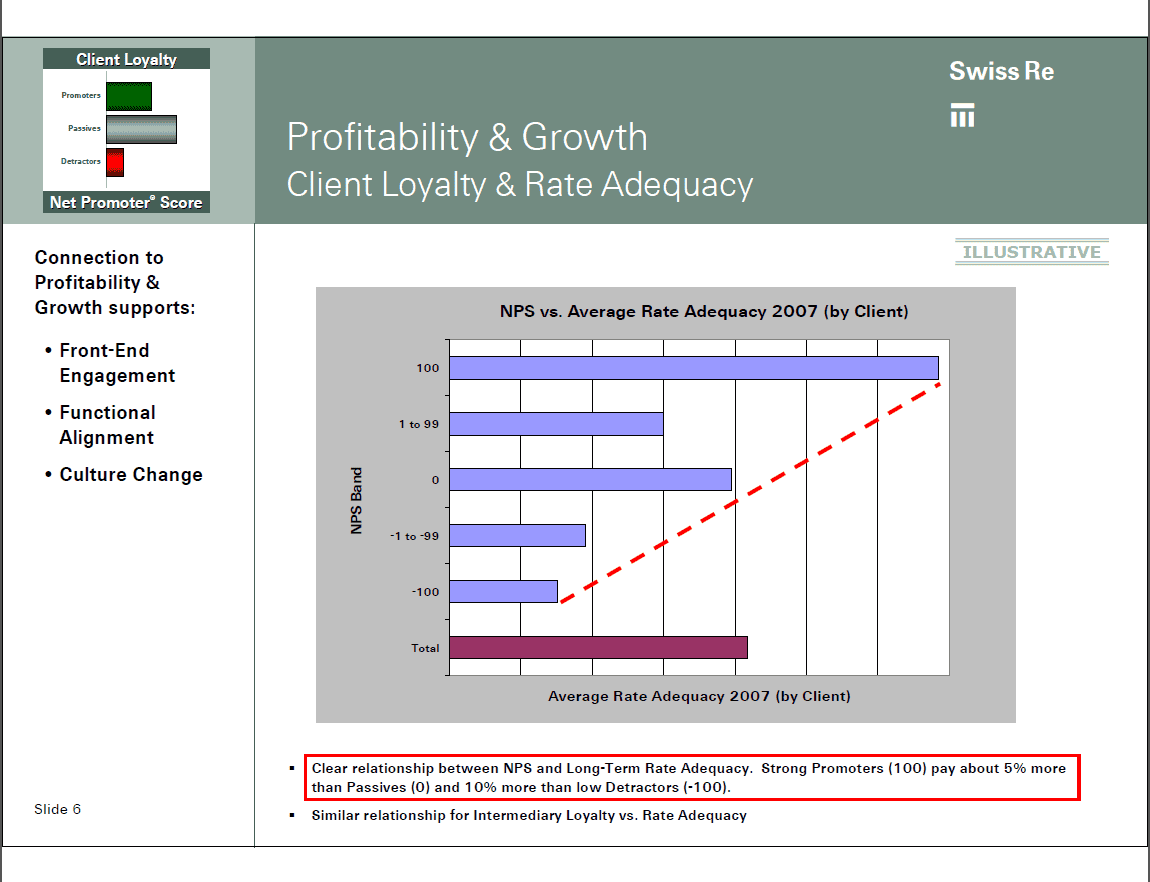
Swiss Re Discovered that Promoters Pay More (B2B)
Swiss Re found that there was a clear relationship between NPS and Long-Term Rate Adequacy. Strong Promoters (100) pay about 5% more than Passives (0) and 10% more than low Detractors (-100).
Source:Swiss Re
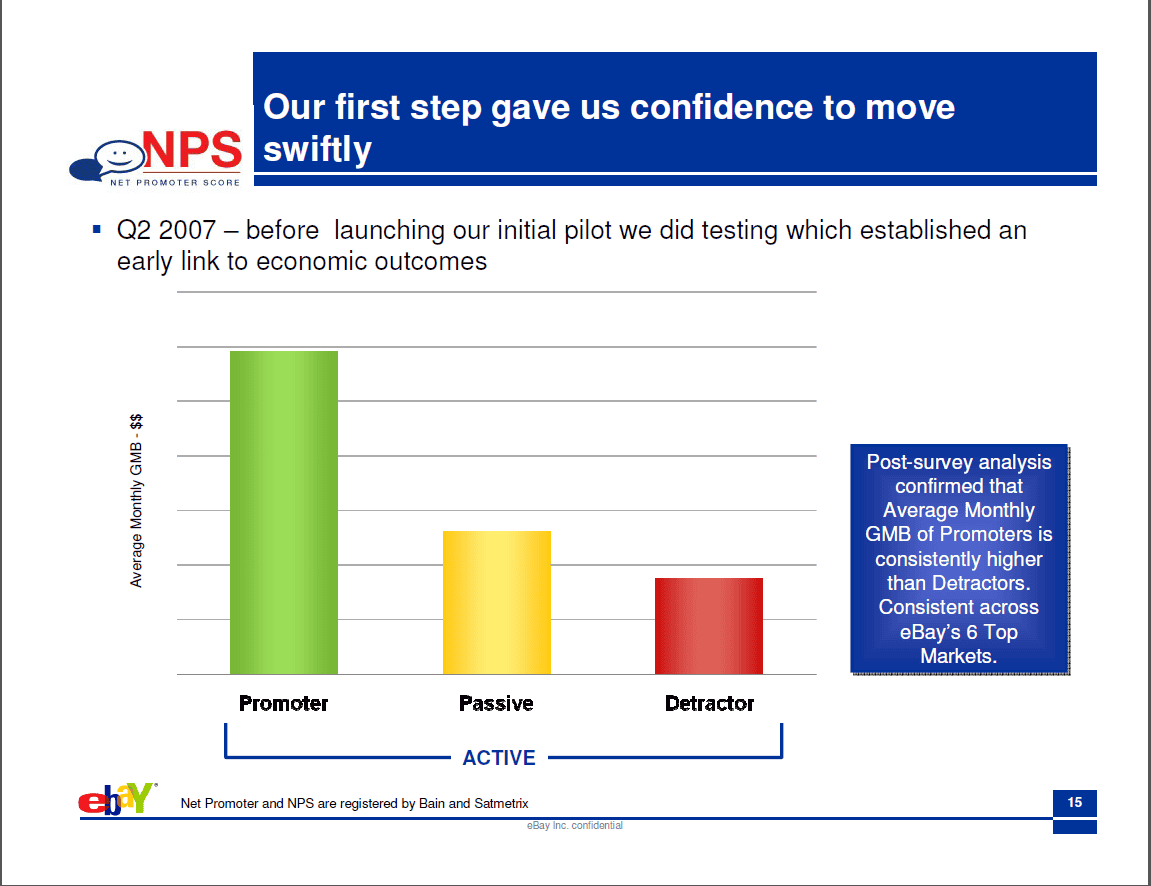
eBay Linked NPS to Revenue (B2C)
eBay found, see chart below, that the average GMB (revenue score) is consistently higher for Promoters than Detractors, across their 6 top markets
Source: eBay
Maersk Link Shipping Increases with increases NPS (B2B)
Maersk correlated a 4 point increase in Net Promoter Scores with a 1% increase in additional volume shipped by customers.
Additionally they found that training improves Net Promoter Scores in local regions.
Maersk gave regional divisions the option of putting regional customer experience councils in place. The 55 regions that have set up local councils also received a three-day training course in customer experience improvement methods. The firm then did a study comparing regions with and without a council. The result: participating local offices score 10 points higher on their NPS than those offices that opted out.
Health Insurance Provider nib links NPS to attrition rates (B2C)
For nib health funds is one of Australia’s leading and fastest growing health fund, The risk of attrition for Detractor respondents is 1.5 times that of Promoter respondents. Plus a one point increase in “Would Recommend” score results in a decreased of risk of termination by 7.8%
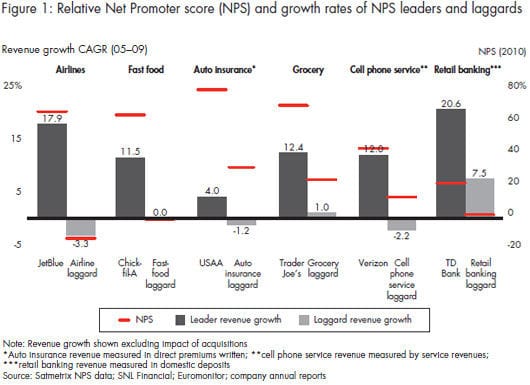
Multi-industry NPS -> Revenue growth linkages (B2C)
More statistics showing that NPS and Revenue Compound Annual Growth Rate ( CAGR) are linked.
American Express Links Shareholder value to NPS (B2C)
We track [NPS] all the way to shareholder value. For a promoter who is positive on American Express, we see a 10% to 15% increase in spending and four to five times increased retention, both of which drive shareholder value. In fact our operating expenses associated with service have gone down because we’re more streamlined, and we limit friction points and errors.
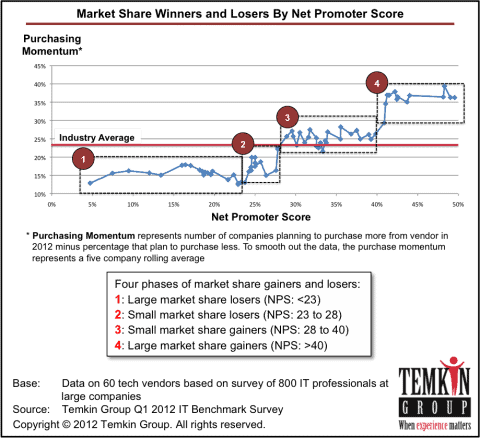
Tech companies NPS linked to purchasing momentum (B2B)
NPS links well to market share momentum for Tech Companies.
Temkin Group surveyed 800 IT professionals from large companies. They asked the IT professionals how much their company was planning to spend in 2012 compared with 2011 and mapped this data with NPS and asked them a series of questions about tech vendors. The result is below.
Full story: Net Promoter Score and Market Share For 60 Tech Vendors
Organge France (Telco) Links Churn to NPS (B2C)
Orange France has identified that NPS is highly correlated with churn propensity.
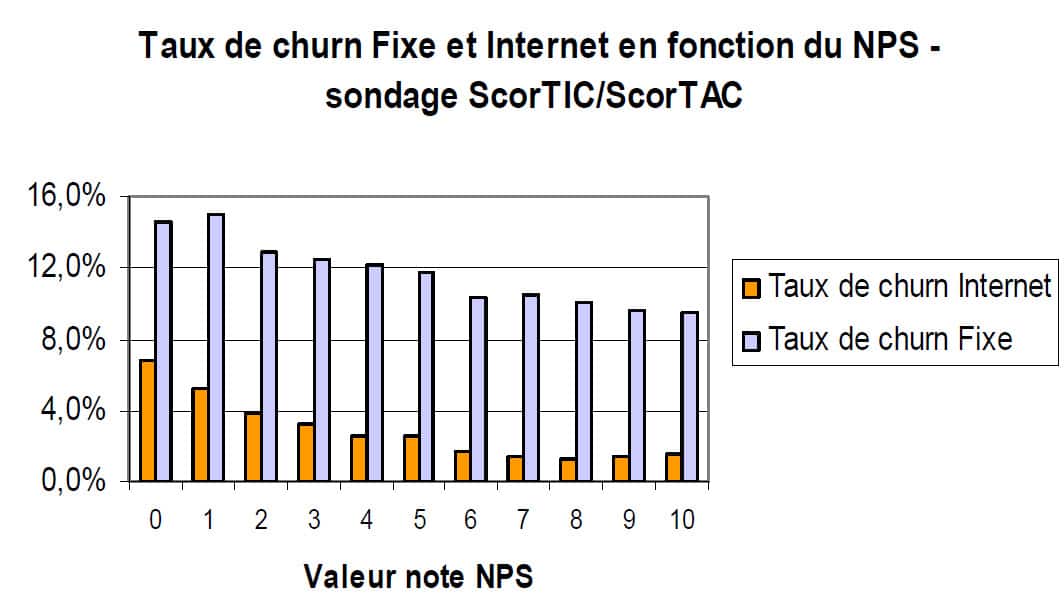
Full story: Orange France – Using NPS as a Lever for Organizational Change
Progressive Insurance Correlates Retention rate to NPS (B2C)
Progressive Crop. has identified a solid correlation between NPS and insurance policy customer retention:
“Three things that I want you to note from this overall segmentation. First, solid correlation between policy life expectancy and Net Promoter Score. So while we monitor, measure and act on Net Promoter Score and make investments to move that, we’re investing to improve our policy life expectancy.”
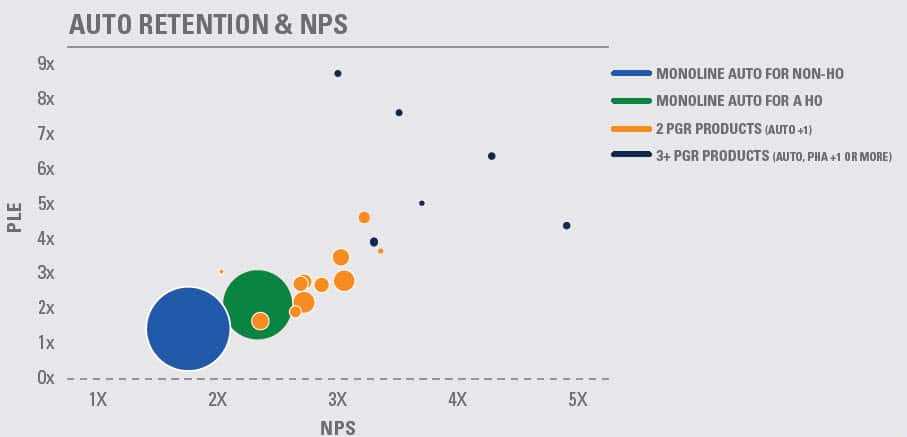
Source: The Progressive Corporation Investor Relations Meeting
Outsourcing Company links sales and revenue to NPS (B2B)
Teletech reports that after NPS methodologies were implemented at one organisation…
NPS increased by 20 percent …
Furthermore, sales and revenue significantly increased. The chat sales conversion rate went up by more than 62 percent, while the amount of revenue generated for chat interactions went up by more than 51 percent.
Bain Calculates the Incremental Value of a Promoter — Multi-industry (B2C)
This data from Bain in 2013 shows the incremental value of a Promoter over a Detractor for a variety of industries. You can see for example that you can more than quadruple the value of a customer in some businesses.
Telco iiNet Directly Links Net Profit to NPS (B2C)
iiNet’s CEO Michael Malone states in this interview that a 1-point increase in their NPS equaled an A$1.6 million increase in net profit after tax
He also explained that iiNet’s customer service team is its “heroes” and claims that a 0.1% improvement in customer churn added up to 20% recurring improvement in sales.
Heineken Links Revenue to NPS (B2B)
What’s the value of driving customer satisfaction? – Promoters spend 2.5 times more than detractors.
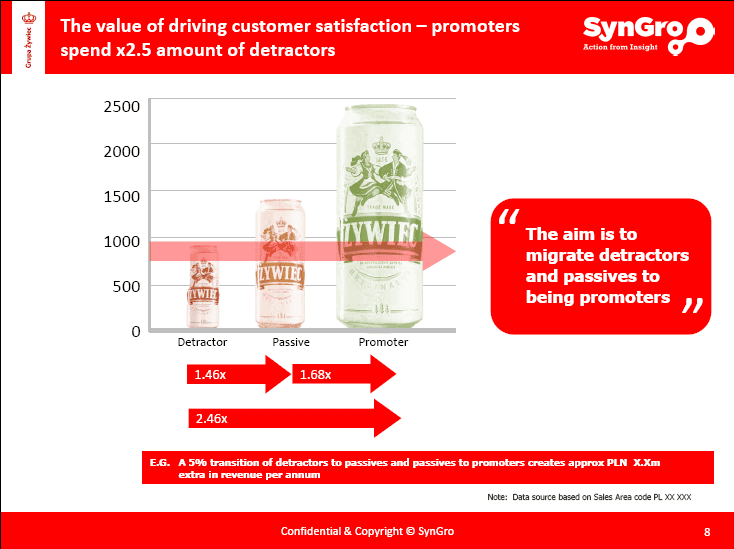
Source : Syngro
Stora Enso (Pulp and Paper manufacturer, B2B)
Company focused on converting Detractors. In a direct comparison of the same group of customers, Stora Enso converted 77% of Detractors to Passives and Promoters.
These “converts” changed their purchasing behaviour as a result:
- Customers who remained Detractors—average sales fell 36%
- Customers who were converted to Passives—average sales increased by 16%
- Customers who were converted to Promoters—average sales increased by 25%
Source: Syngro
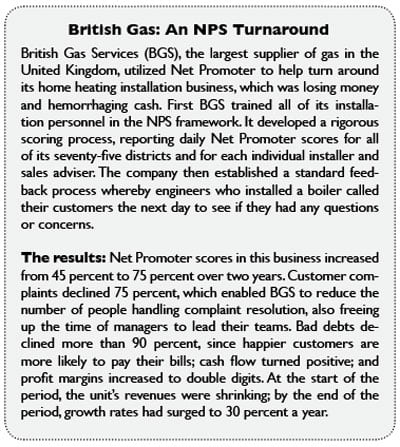
British Gas NPS Turn Around (B2C)
British Gas’s NPS program delivered substantial returns.
Symantec Reduces Costs (B2C)
Symantec implemented Net Promoter in the part of the business that develops and market “Norton” products. In the process they substantially lifted their Net Promoter score and delivered, amongst other benefits:
- Support achieved a 10-12% reduction in call times, plus agents now handle an average of 1.6 customers at a time.
- 30% reduction in support costs was reinvested in the customer experience, keeping overall budgets flat.
Source: Satmetrix Case Study
Last Updated: 29 July 2022