Calculating Customer Life Time Value in Retail Settings
Fader and Hardie's CLV models are well known in marketing academia and largely ignored in marketing practice — partly because the source papers are dense, partly because nobody distils the actionable steps. Here they are for retail and other non-contract continuous-purchase customer bases — what data you need, the assumptions to check, and how to use the results.
On this page
In this post I summarize the actionable steps of a substantial body of work by Peter Fader, Bruce Hardie, et. al. in calculating customer lifetime value for various types of customer bases. CLV is a critical part of every customer experience program.
The relevant source papers are referenced at the end of the post. The details of the statistical models are deliberately excluded from this summary but can be reference in the source papers.
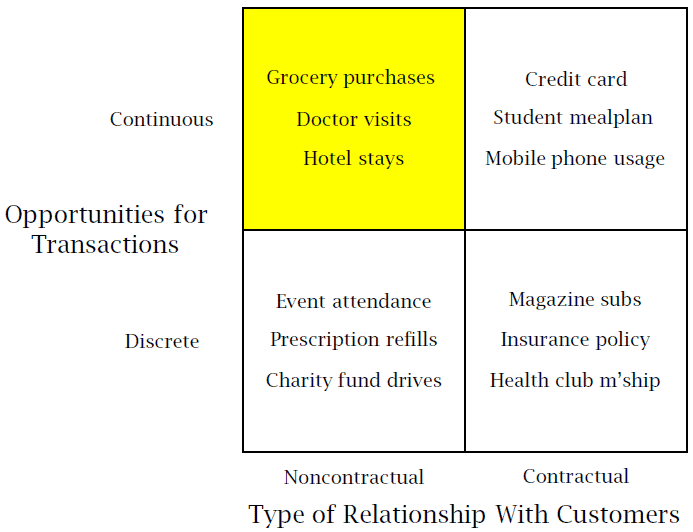
In this post, we will focus on the top left quadrant of the Fader/Hardie customer relationship map (as I will refer to it) .
We will be examining situations where there is no on-going contract between the supplier and the customer and where the customer can purchase at any time.

Source: See Reference 3.
Where does this apply?
This approach is applicable to customer base analysis in many retail situations; books, groceries, gifts, etc. It is also applicable to recreational purchases, for instance hotels, restaurants, cinemas , etc. and service visits, doctors, etc.
Key assumptions to check
- There is no on-going contract for sale
- The customer is able to purchase at any time, in contrast to, say, purchasing a periodical magazine that can only be purchased at a set time each period.
- After each transaction the customer has a chance to “drop out” or cease to purchase from the company again but the company does not know when this has happened.
- Different customers can have different probabilities to drop out
- Transaction rates can vary by customer but each customer transacts randomly around their mean transaction rate.
- You should re-validate the model variables for different cohorts of customer. “Different” in this context can mean: different acquisition channels, time of acquisition, etc.
Data needed to model
To use this approach you will need to have a relatively small amount of information for each customer:
- How many transactions occurred in the period
- The time of the last transaction
- The period over which transactions could have occurred.
Gather this data as one row per customer, e.g.:
Customer#, Number of Transactions, Time of Last Transaction, Total Duration
Approach taken
The 30 second version is that the customer transaction process is modeled in terms of different probability distributions. Excel’s Solver function is then used to determine the key variables that define the shape of those distributions. Once the key variables are known they are plugged into equations that have been developed to estimate important business outcomes such as future customer value, expected number of purchase in the next period, etc.
The full version (using the Fader et al. derived beta-geometric/NBD model) is more complex and you should review the referenced papers in detail for more information.
Values you can determine
The authors have derived a variety of useful equations to determine use customer values:
- Sales Forecast for a future period by the cohort
- Discounted expected future transactions for a specific customer cohort.
- Predicting the number of purchases that a specific customer will make in a defined future period, based on that customer’s purchase history.
Each of these equations can be implemented in Excel, although they are not what you would call trivial.
How would you use it?
The first and most simple use for this information is simply to create a more accurate sales forecast for a business in a non-contractual setting.
However, a more interesting and useful approach would be to use the model to determine when to take some customer treatment based on their expected future purchase pattern. This is made easier because the expected future purchases for a customer do not have to be calculated for each customer individually, they can be grouped into profiles.
After the model has been created, a simple look-up approach based on the three key data points (number of transactions, last transaction, period) gives the expected future purchases for all customers with that profile. Customers can then be simply scored for action on that basis. Implementing the intervention is thus made much easier.
Implementing this approach
The implementation details of this customer base analysis approach are contained withing the following referenced papers, tutorials and examples.
- Counting Your Customers the Easy Way, an alternative to the Pareto/NBD model
- Implementing the BG/NBD Model for Customer Base Analysis in Excel, includes notes and a sample Excel spreadsheet on how to implement the approach.
- Probability Models for Customer-Base Analysis